Charts and Reports
With Chime for XMPP, you can quickly render, download, and export many types of charts and reports about the conversations that have taken place within Chime.
- Both managers and admins have the ability to view system level and queue level charts and reports.
- Managers can only view charts and reports for the queue or queues they are responsible for managing.
- Admins can view charts and reports for any and all queues within the entire system.
System Level (Click the Chart Name for a screen shot of an example)
| Chart Name | Chart Description | Chart Type |
|---|---|---|
| Abandoned Chat Percent by Queue | Shows the percent of abandoned chats vs accepted chats for a queue | Split Bar Graph |
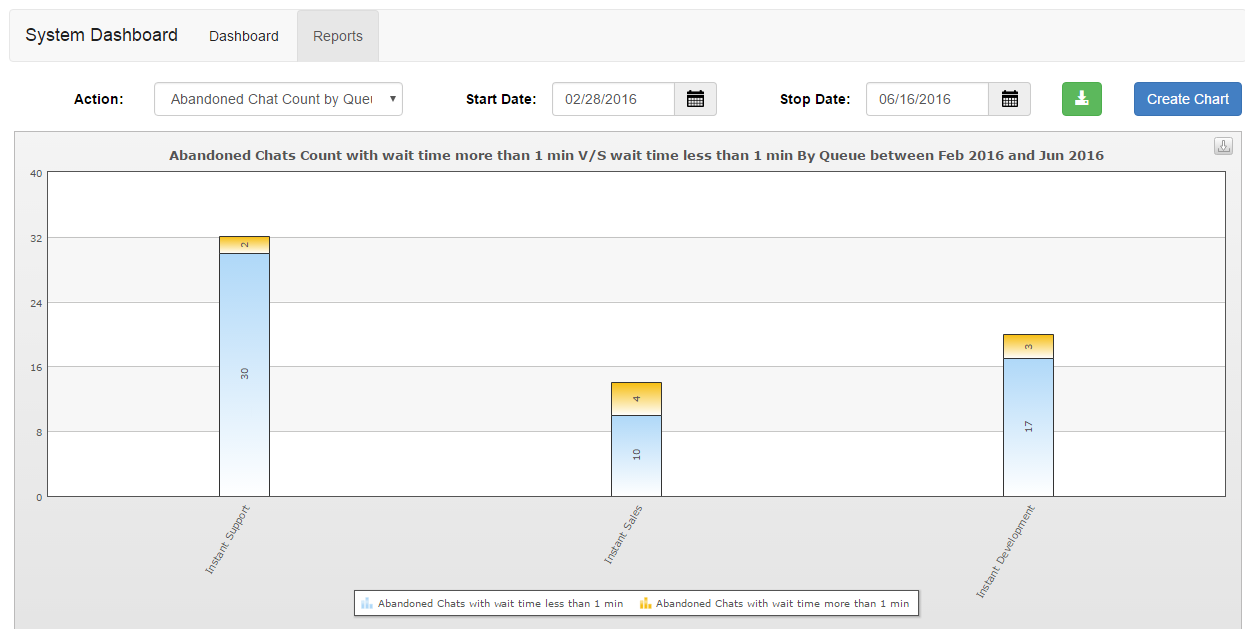
| Abandoned Chat Count by Queue with Ignore Interval | Shows the abandoned chats count with wait time more than 1 min vs wait time less than 1 min by queue | Split Bar Graph |
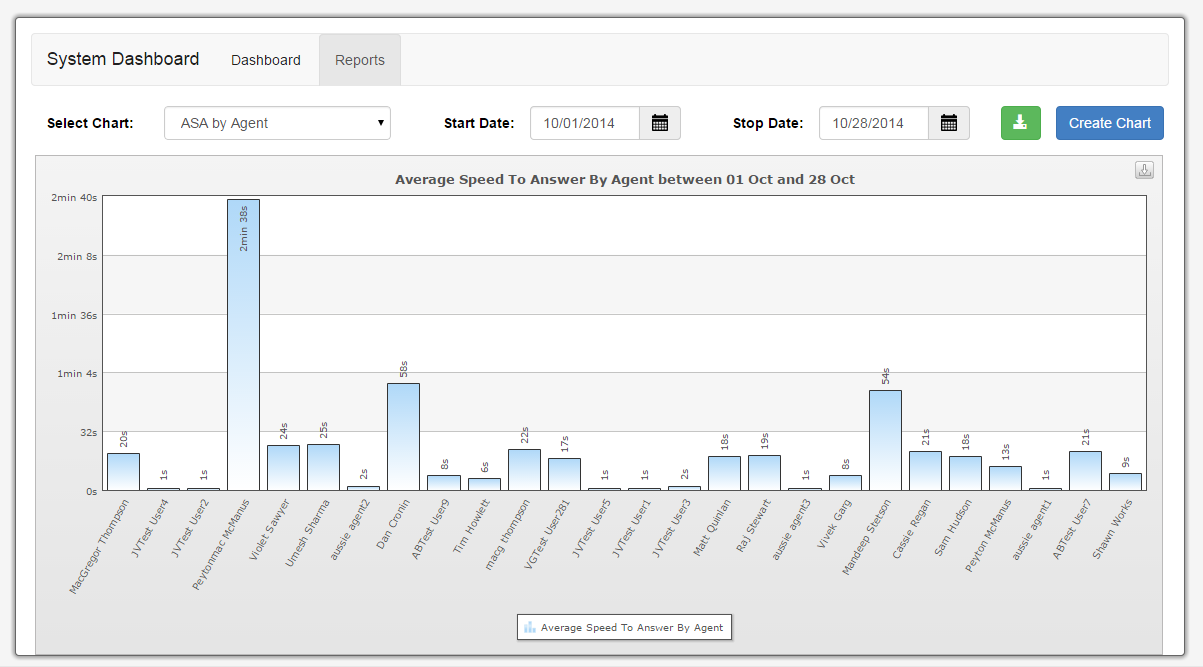
| ASA by Agent | Average Speed to Answer by agent | Bar Graph |
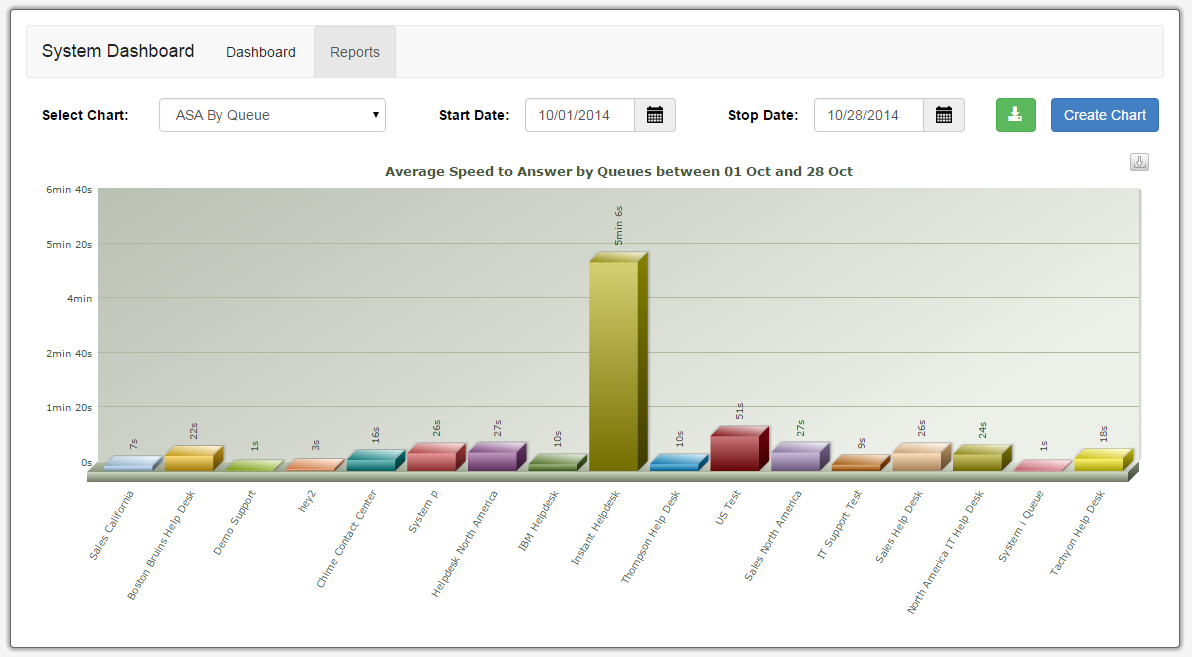
| ASA by Queue | Average Speed to Answer by queue | Bar Graph |
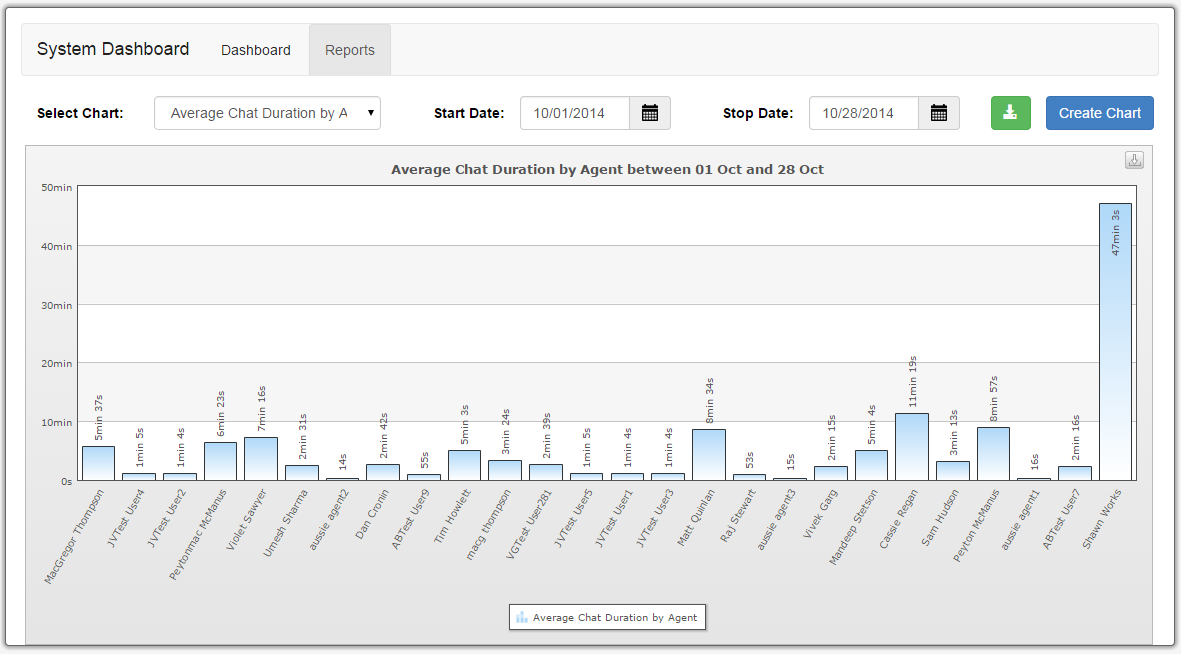
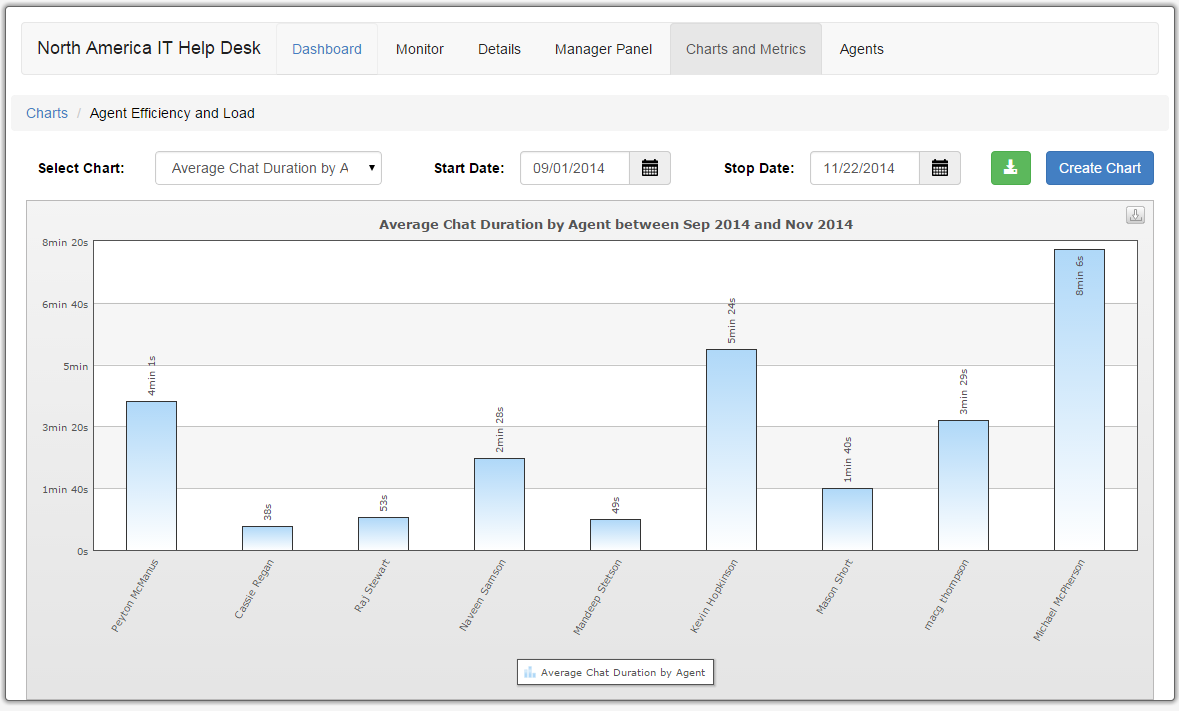
| Average Chat Duration by Agent | Average total time spent in each chat by an agent | Bar Graph |
| Average Chat Duration by Queue | Average total time spent in each chat by an agent | Bar Graph |
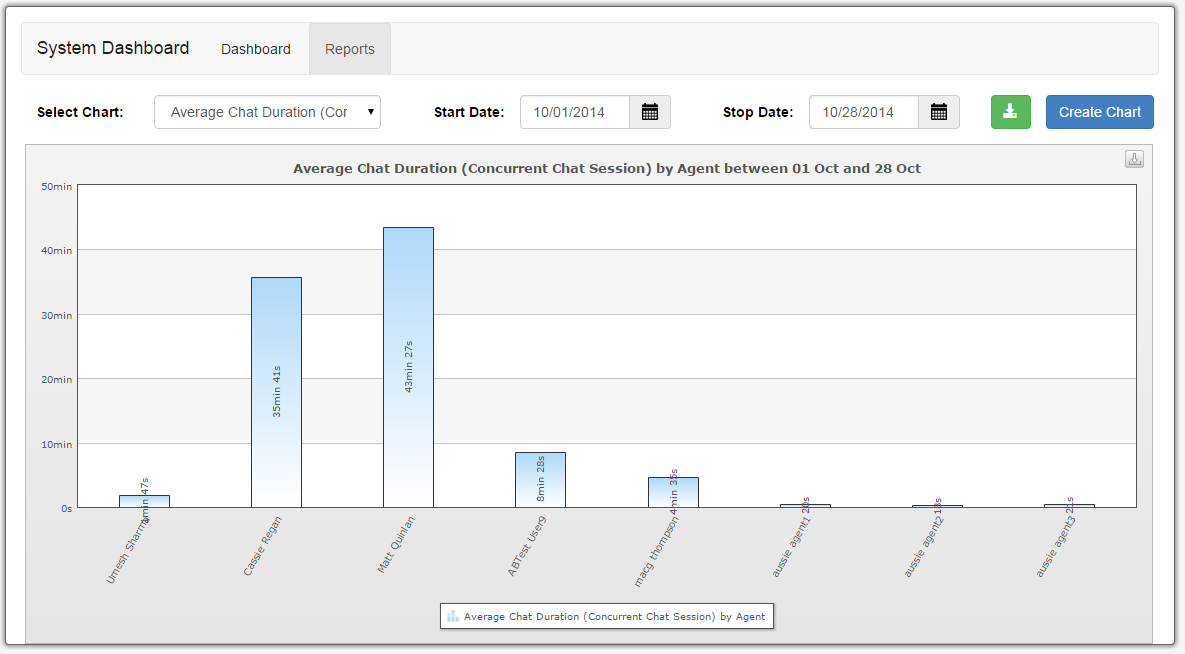
| Average Chat Duration (Concurrent Chat Session) by Agent | Average total time spent in each chat by all agents in a queue | Bar Graph |
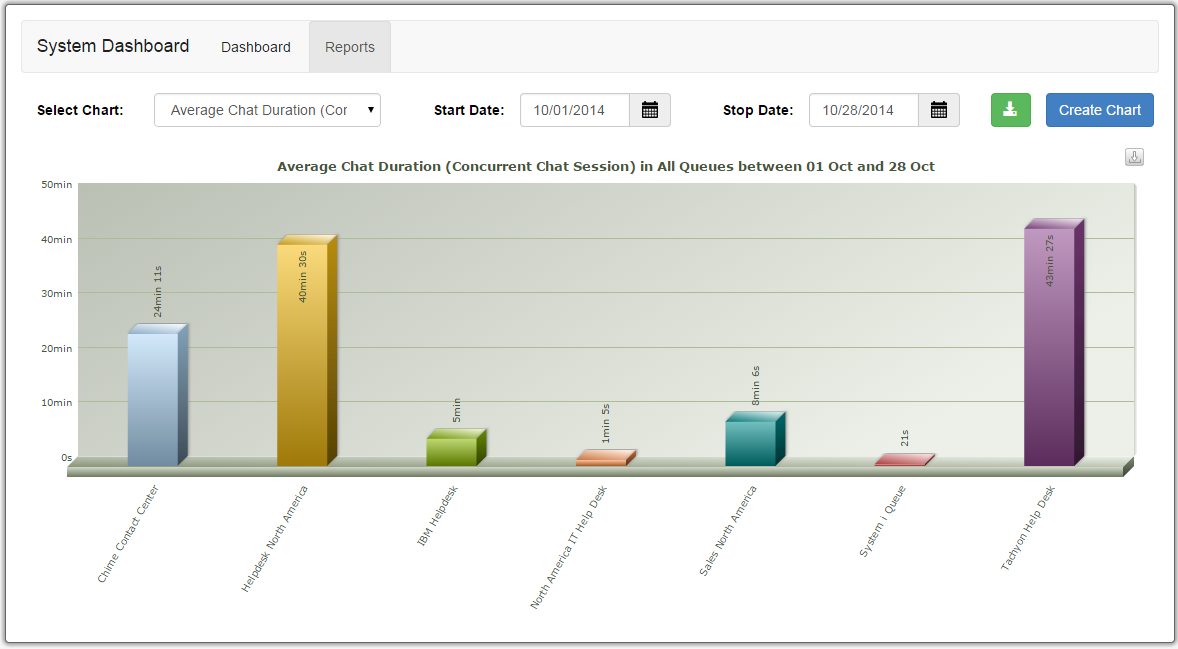
| Average Chat Duration (Concurrent Chat Session) by Queue | Average chat duration of all agents in the queue while being in concurrent chat sessions | Bar Graph |
| Average Chat Duration (Concurrent Chat Session with ACW) by Agent | Average chat duration of all agents in After Chat Work mode from one chat while on a concurrent chat | Bar Graph |
| Average Chat Duration (Concurrent Chat Session with ACW) by Queue | Average chat duration of all agents in the queue spent in a concurrent chat session while in After Chat Work mode | Bar Graph |
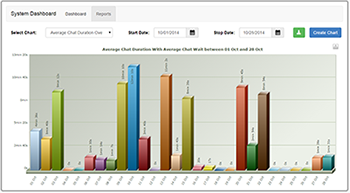
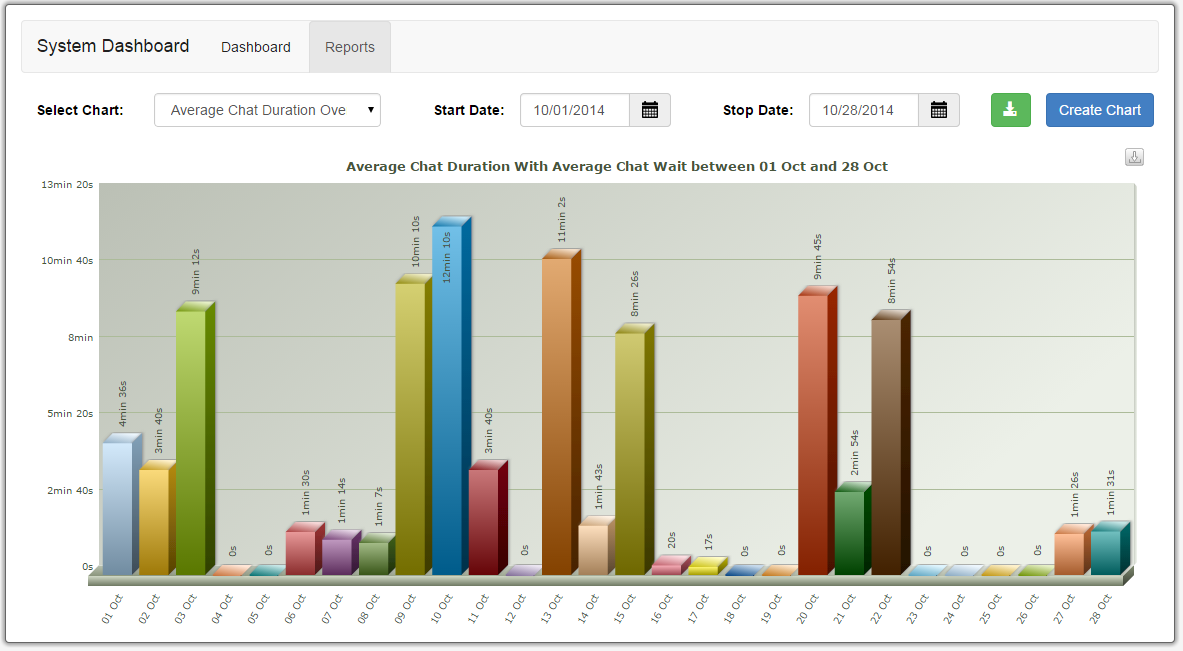
| Average Chat Duration Over Time | Average chat duration, including wait time, per day or month | Bar Graph |
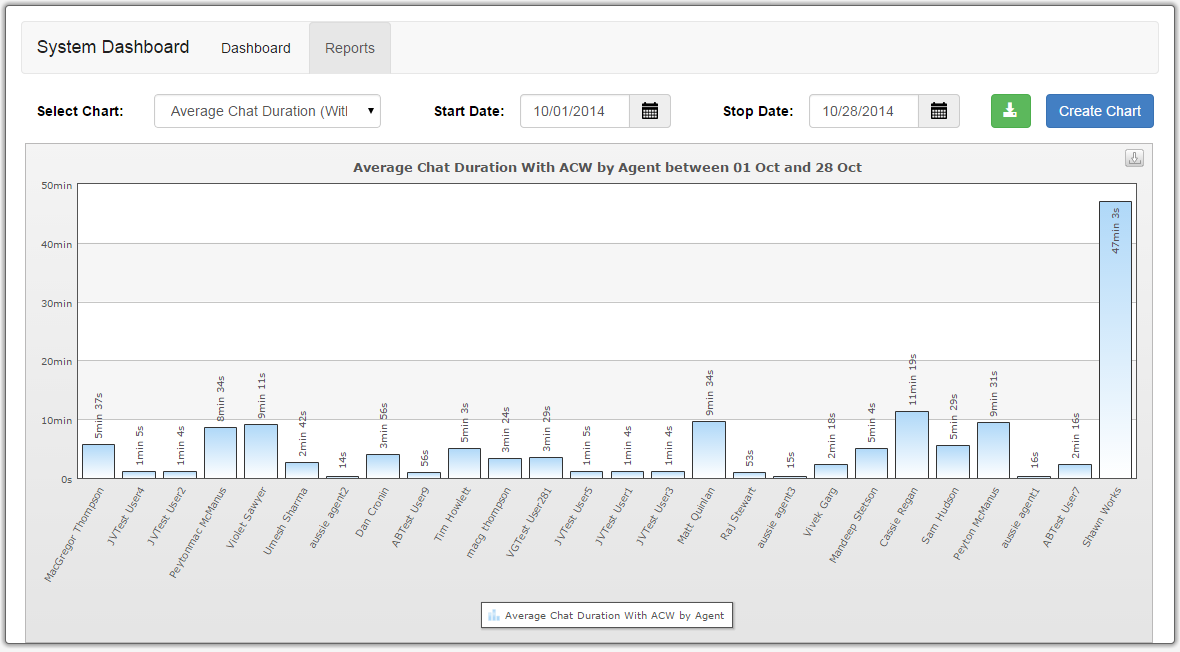
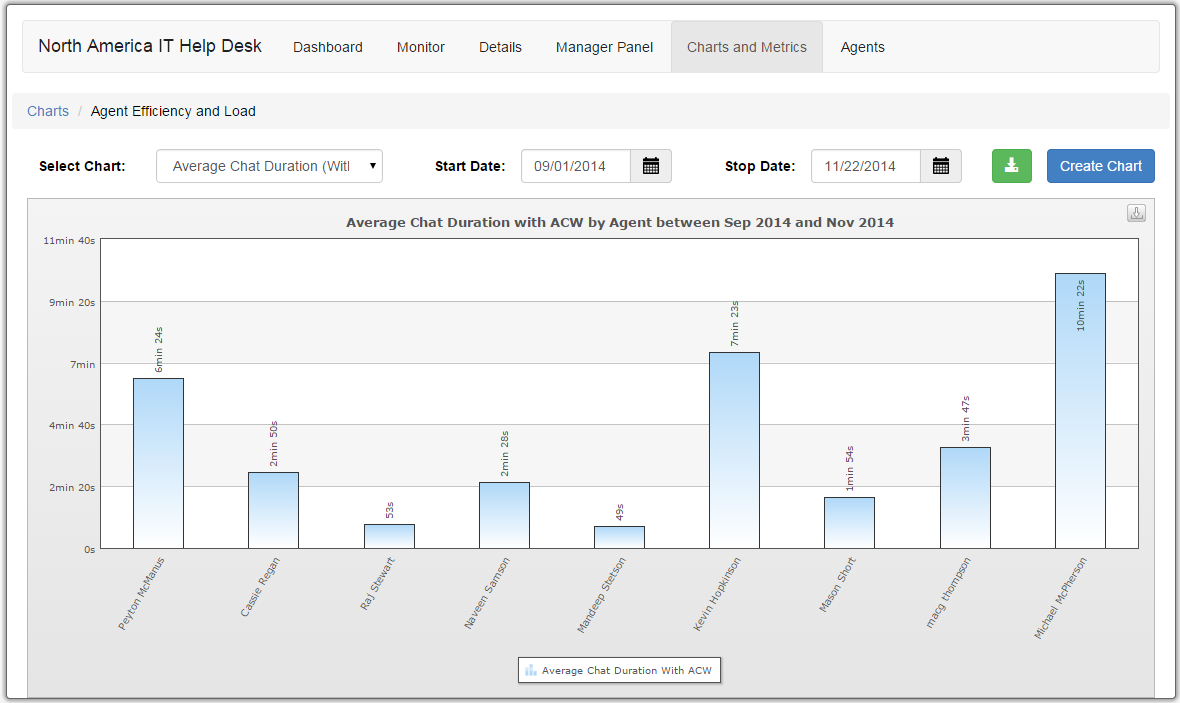
| Average Chat Duration (With ACW) by Agent | Average chat duration of each agent while in After Chat Work mode | Bar Graph |
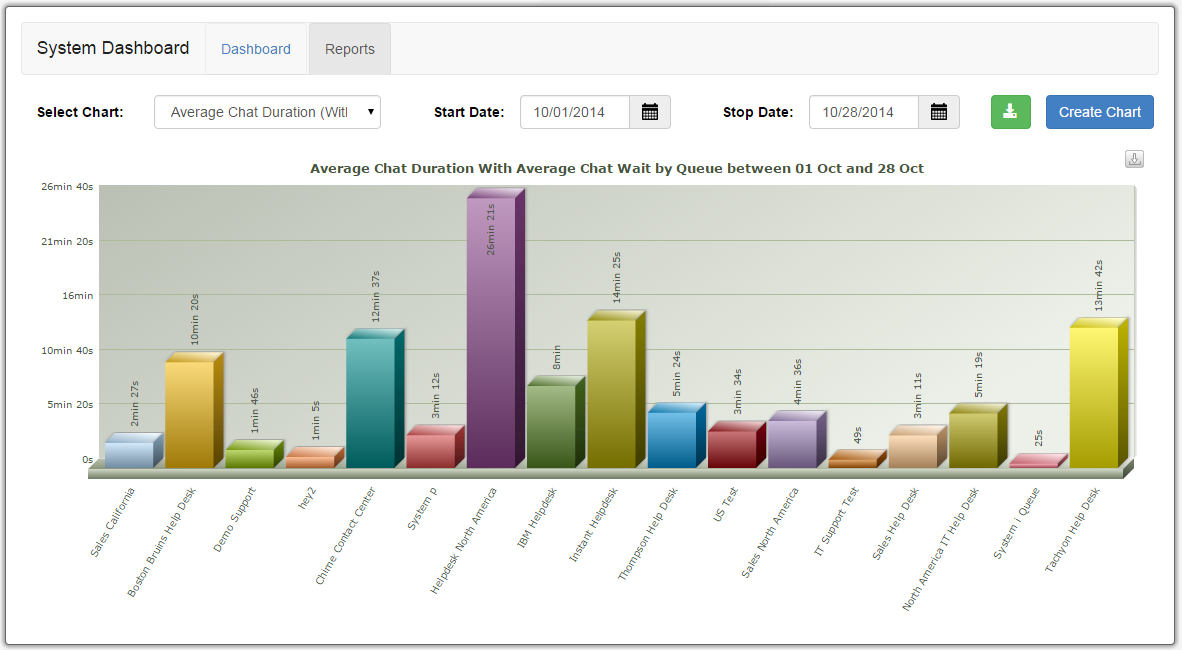
| Average Chat Duration (With ACW) by Queue | Average chat duration of all agents in each queue while in After Chat Work mode | Bar Graph |
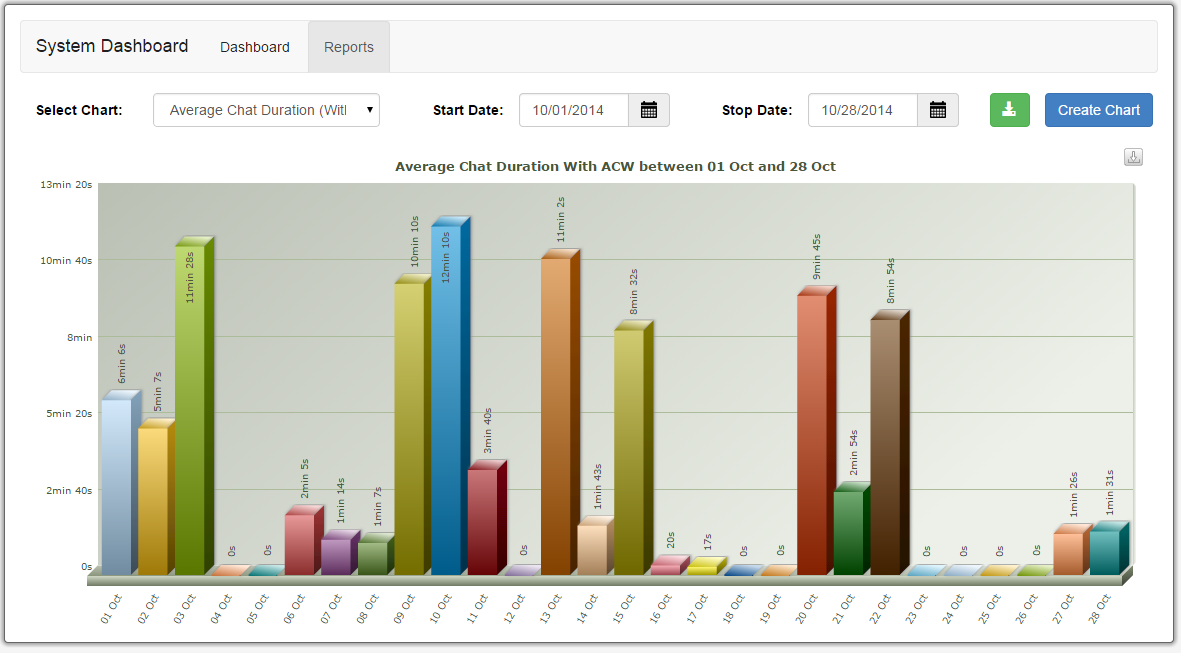
| Average Chat Duration (With ACW) Over Time | Average chat duration, including wait time, of all agents in each queue per day or month | Bar Graph |
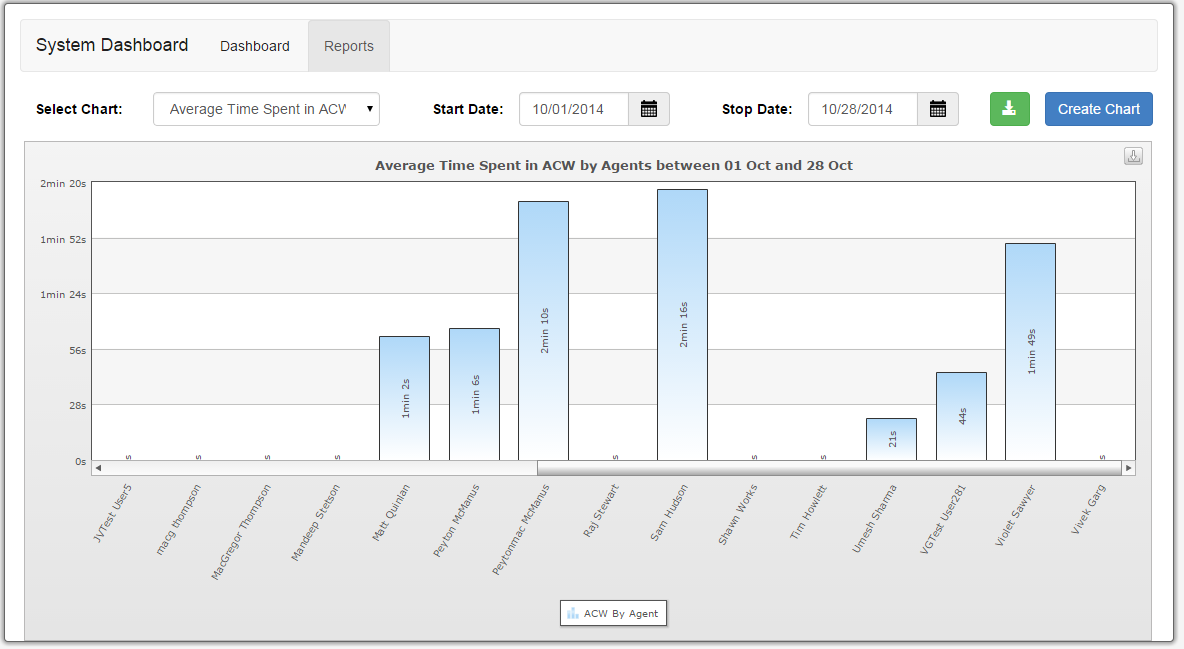
| Average Time Spent in ACW by Agent | Average time spent in After Chat Work mode after each chat has ended per agent | Bar Graph |
| Chat Details for One Day | Shows chat details in one day for all queues | Table Chart |
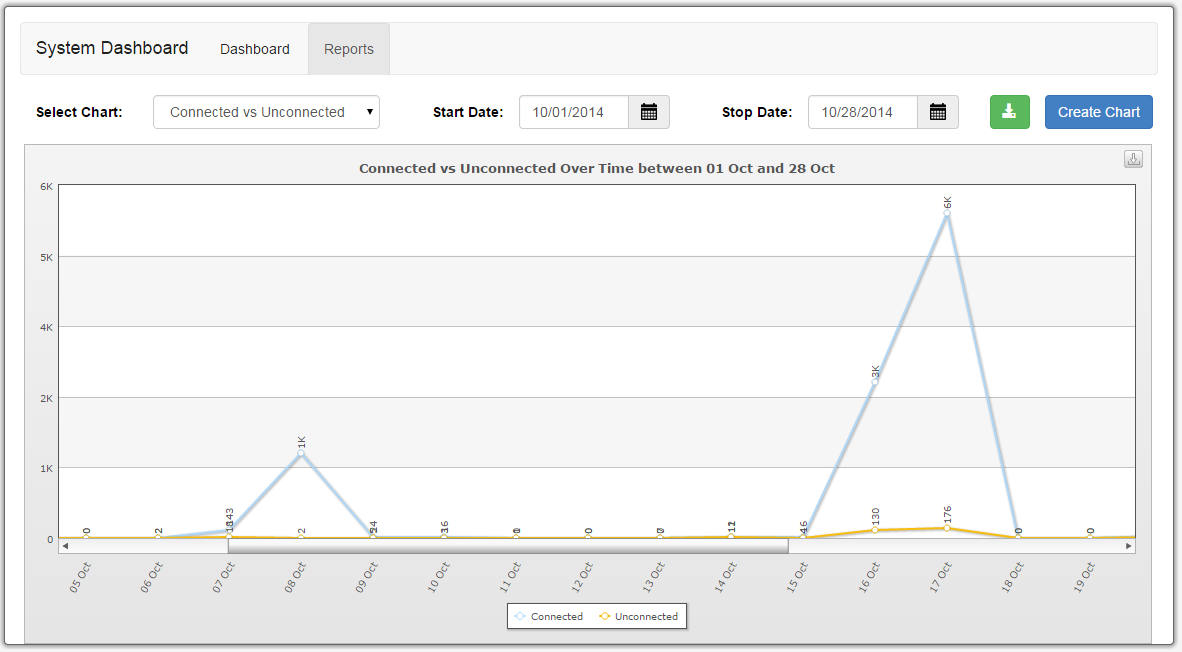
| Connected vs Unconnected | Shows the total number of both connected and unconnected chats for all combined queues per day or month | Line Graph |
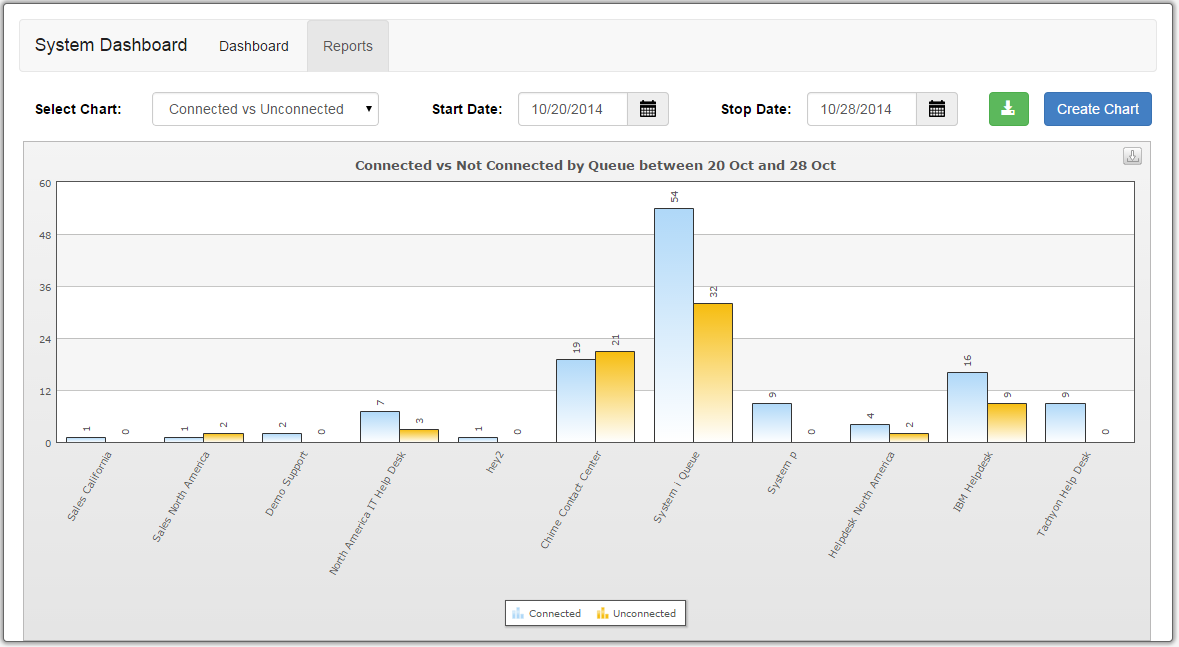
| Connected vs Unconnected by Queue | Shows the total number of both connected and unconnected chats for each queue per day or month | Bar Graph |
| Concurrent Chat Percent by Agent | Percentages of concurrent chats vs. single chats for each agent | Split Bar Graph |
| Concurrent Chat Percent by Queue | Percentages of concurrent chats vs. single chats of all agents for each queue | Split Bar Graph |
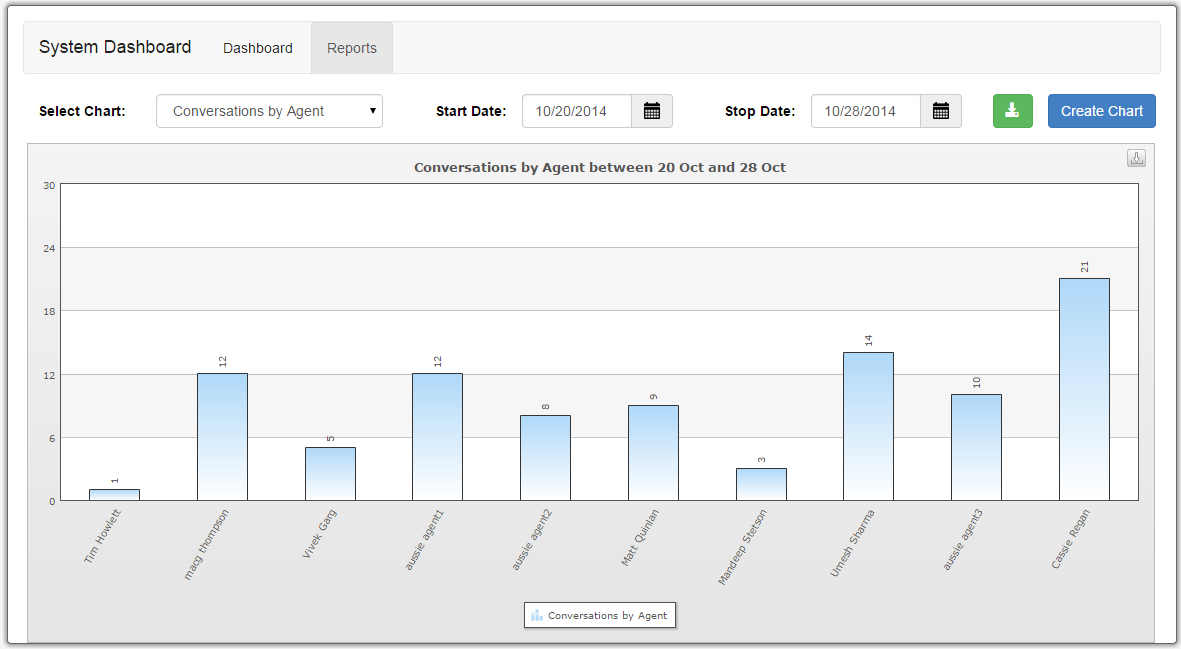
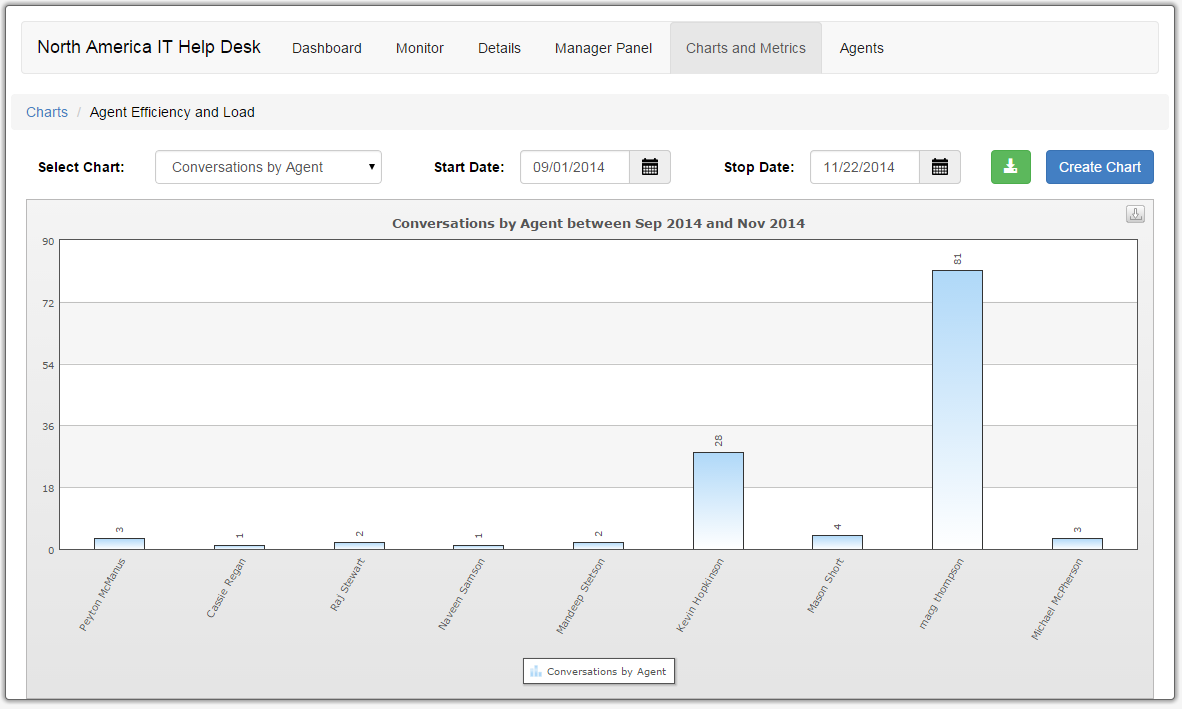
| Conversations by Agent | Total number of conversations for each agent | Bar Graph |
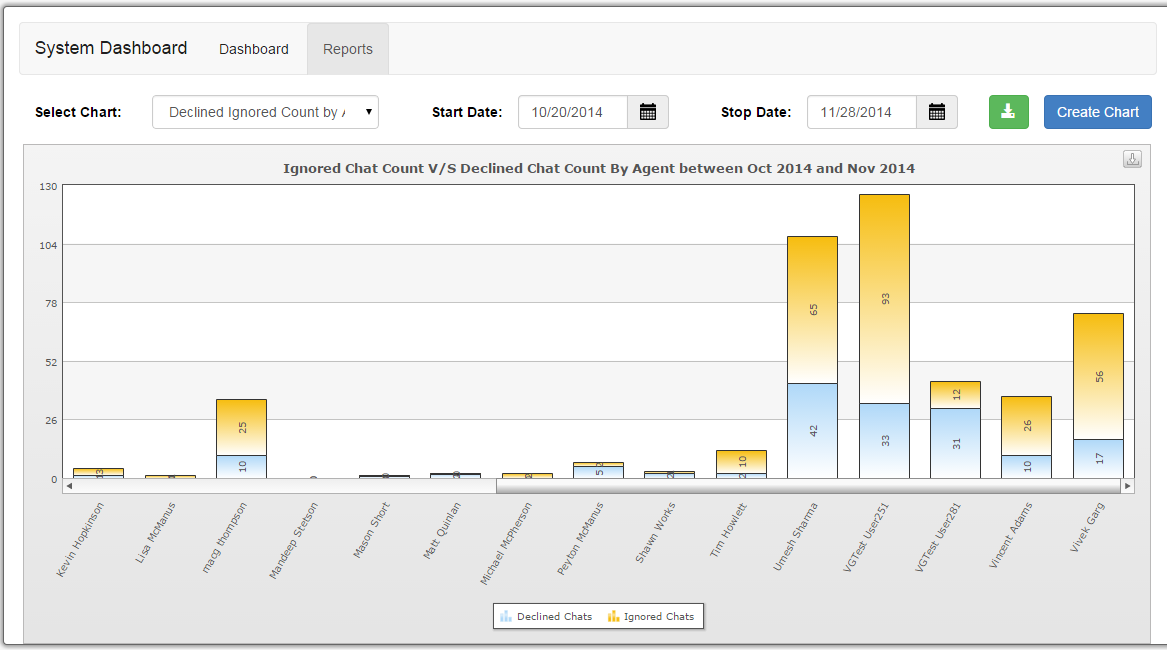
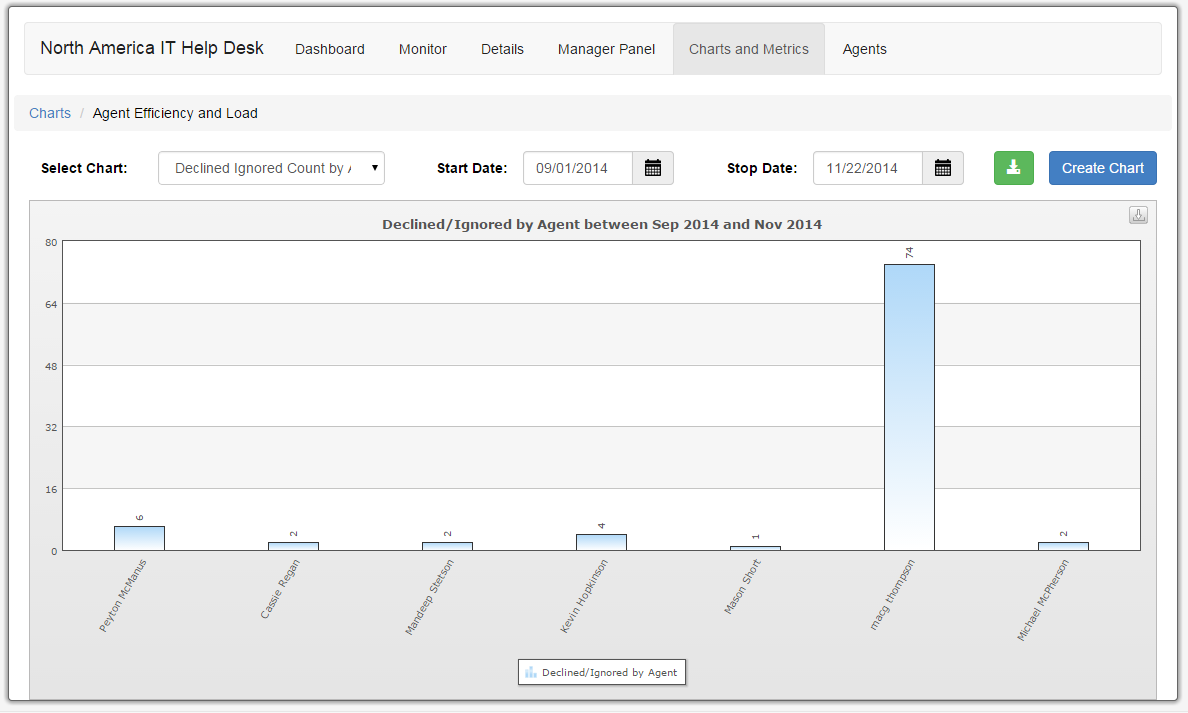
| Declined Ignored Count by Agent | Total number of ignored chats vs. declined chats for each agent | Split Bar Graph |
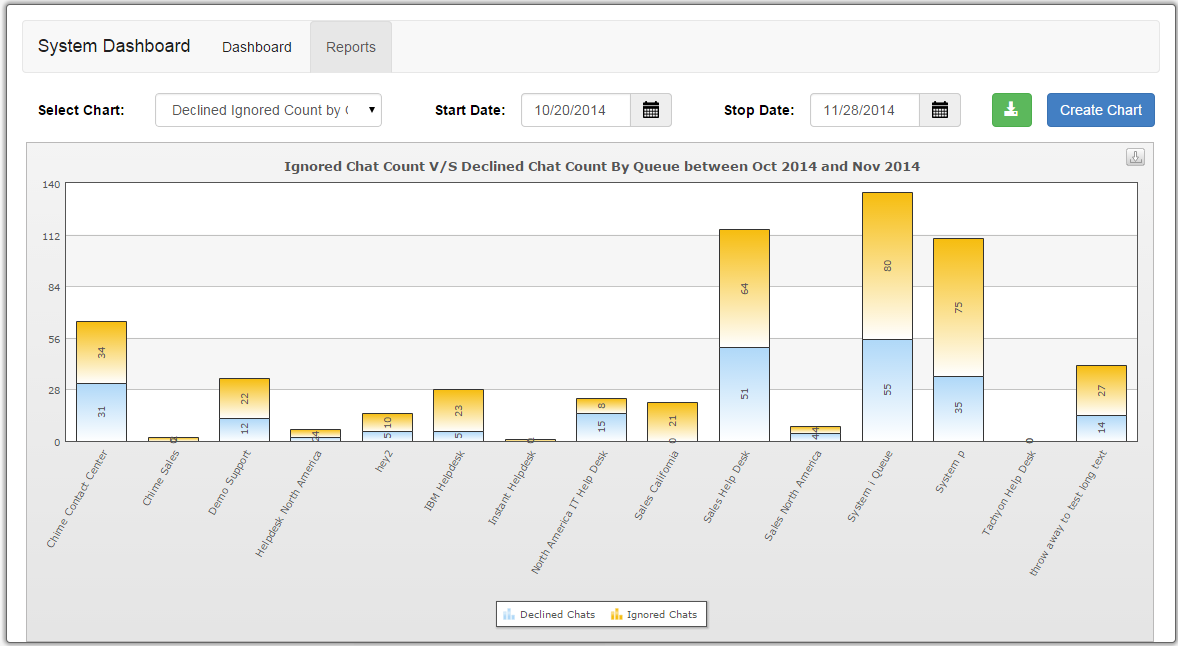
| Declined Ignored Count by Queue | Total number of ignored chats vs declined chats of all agents for each queue | Split Bar Graph |
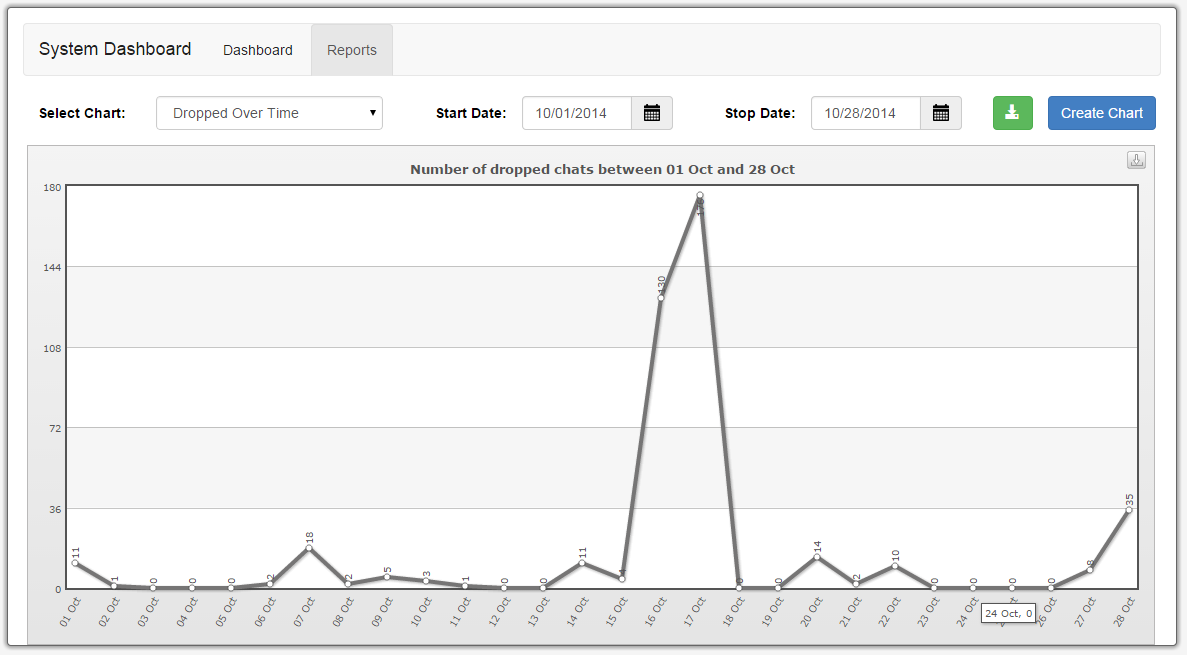
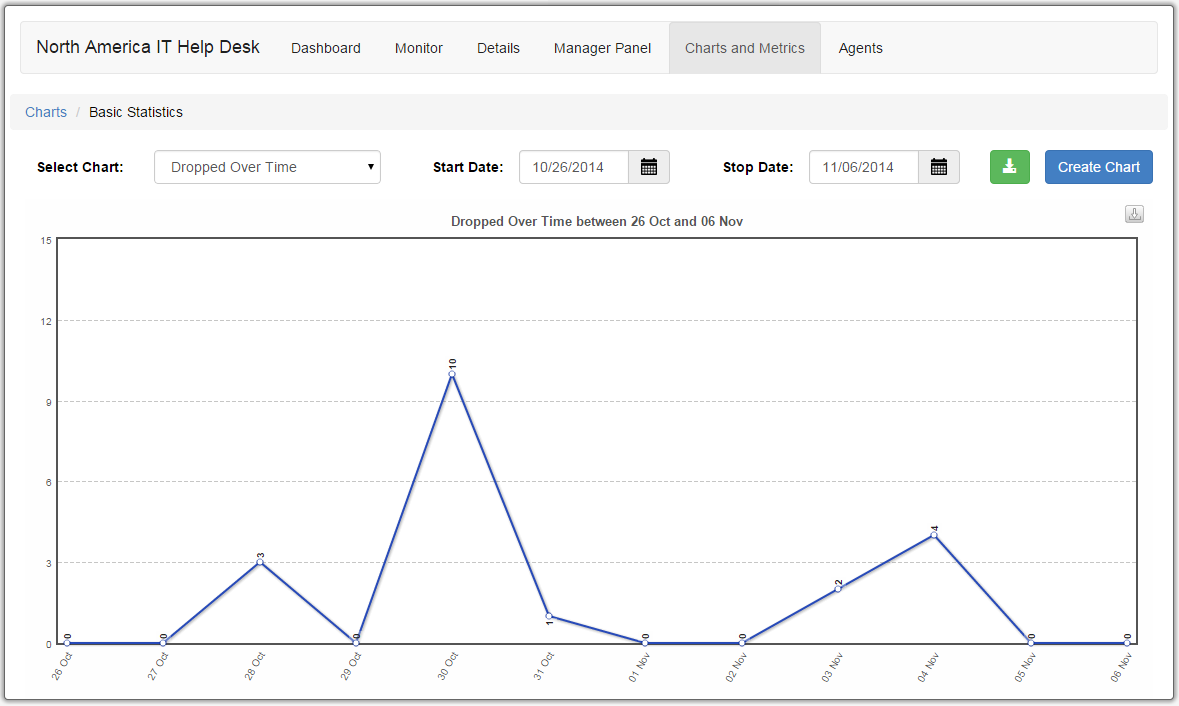
| Dropped Over Time | Total number of dropped chats per day or month | Line Graph |
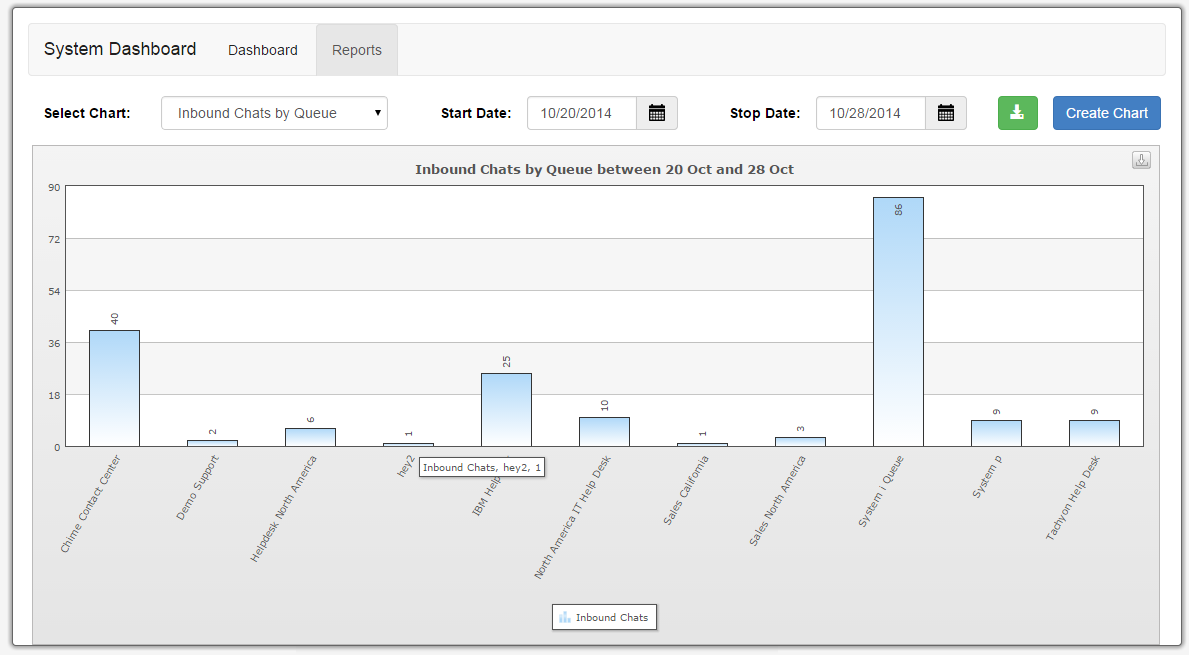
| Inbound Chats By Queue | Total number of inbound chats for each queue | Bar Graph |
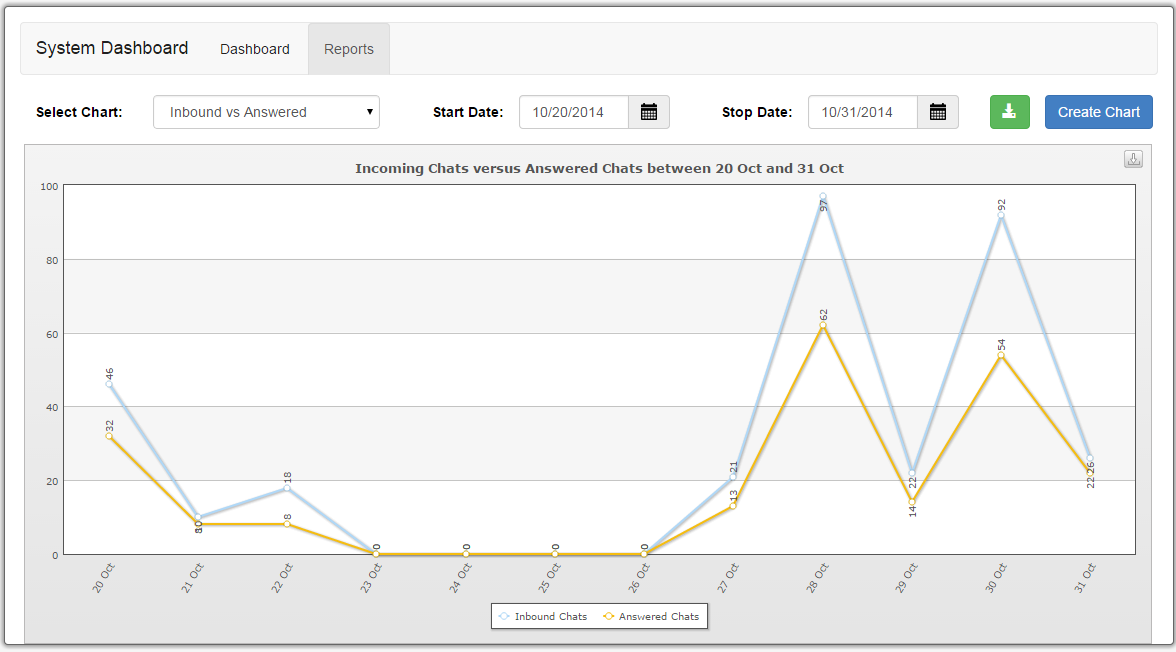
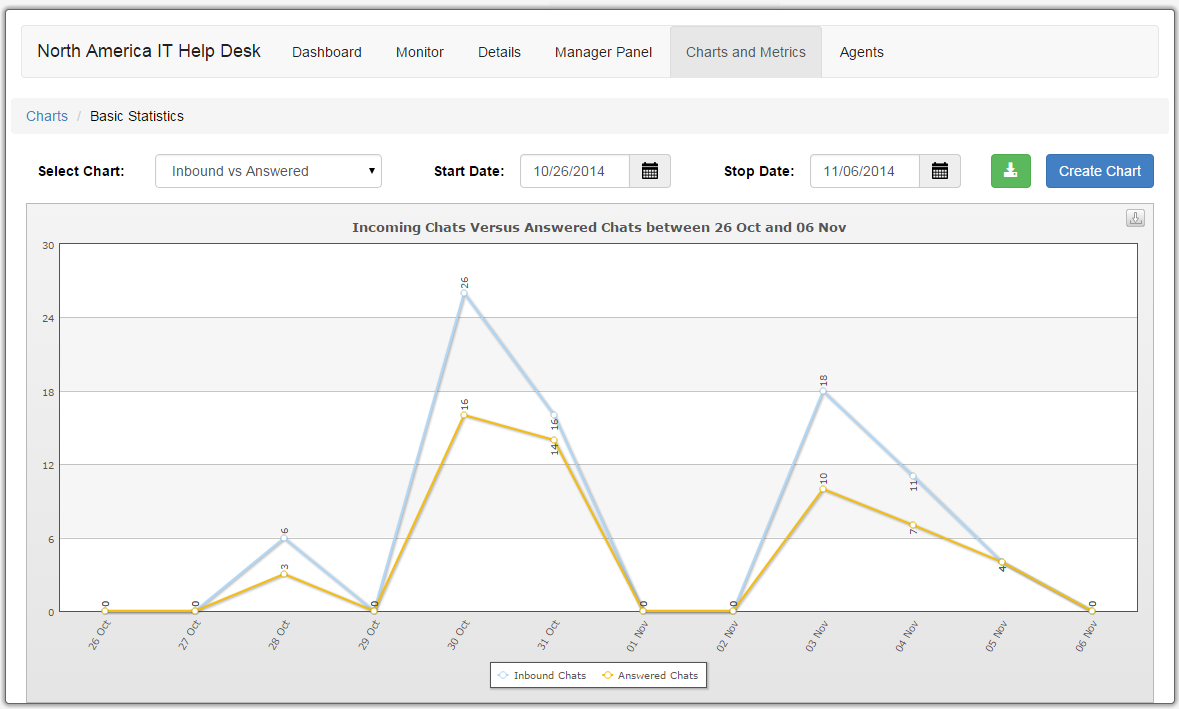
| Inbound vs Answered | Total number of inbound chats vs. answered chats per day or month | Line Graph |
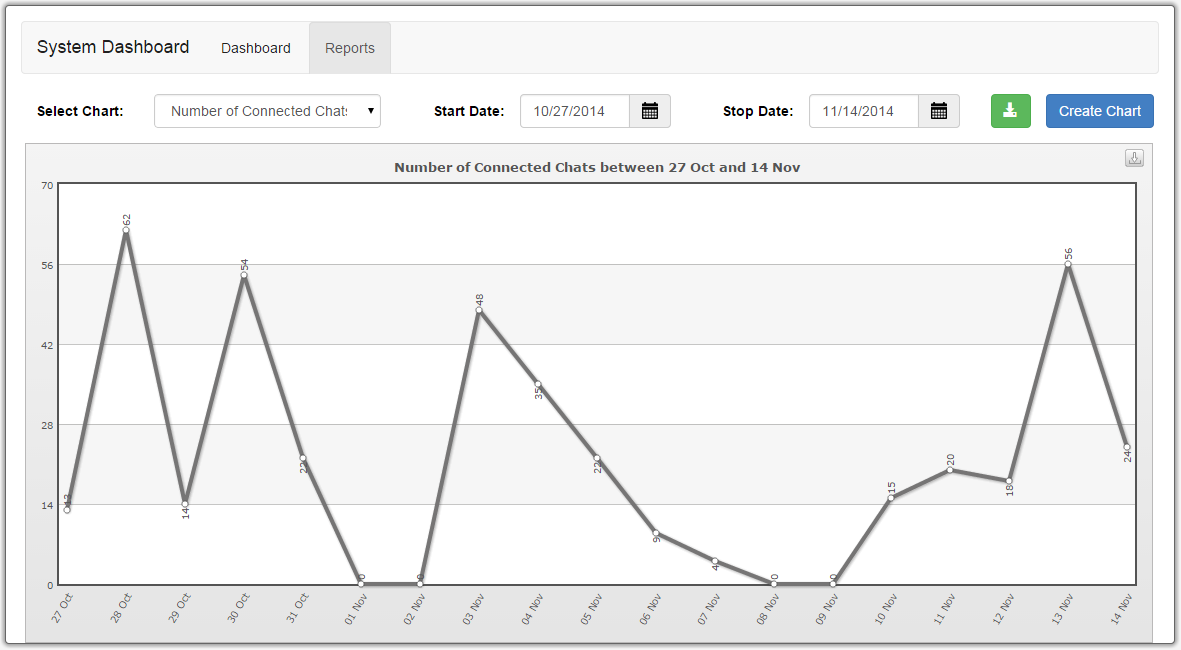
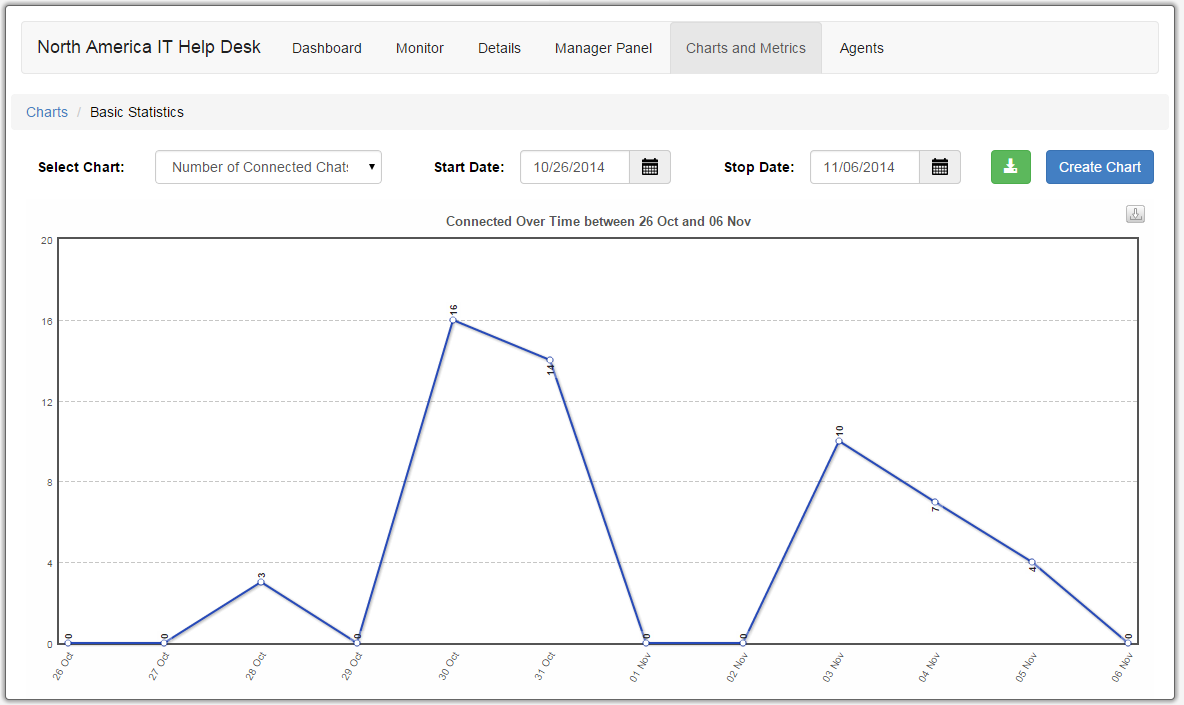
| Number of Connected Chats | Total number of connected chats | Line Graph |
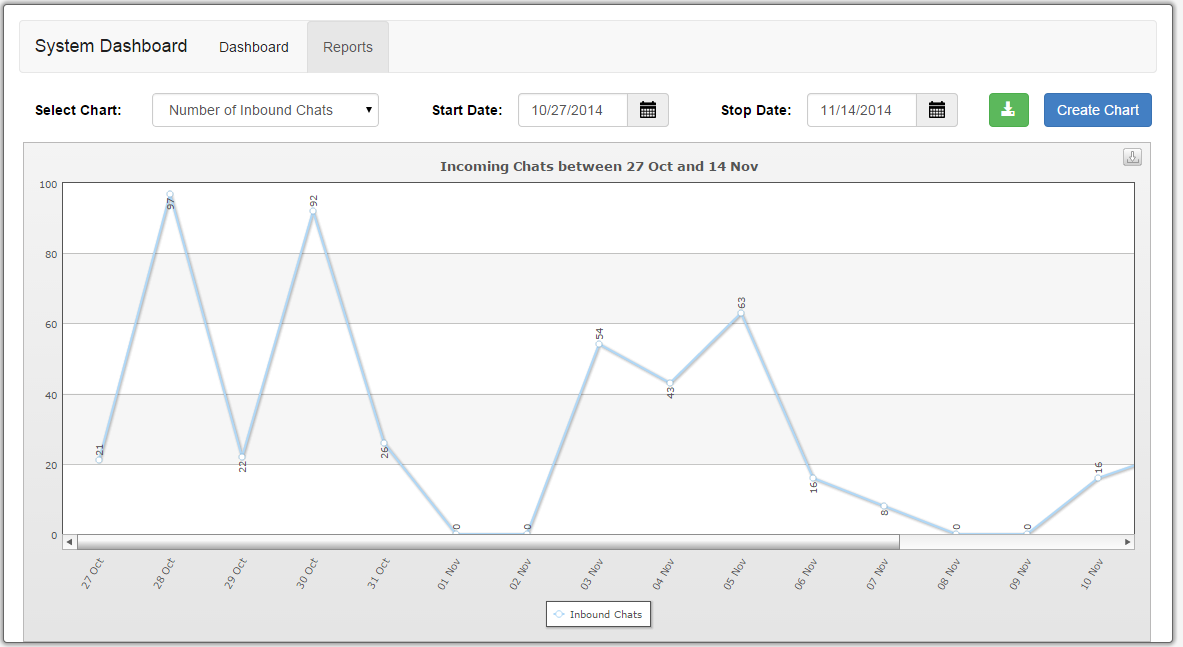
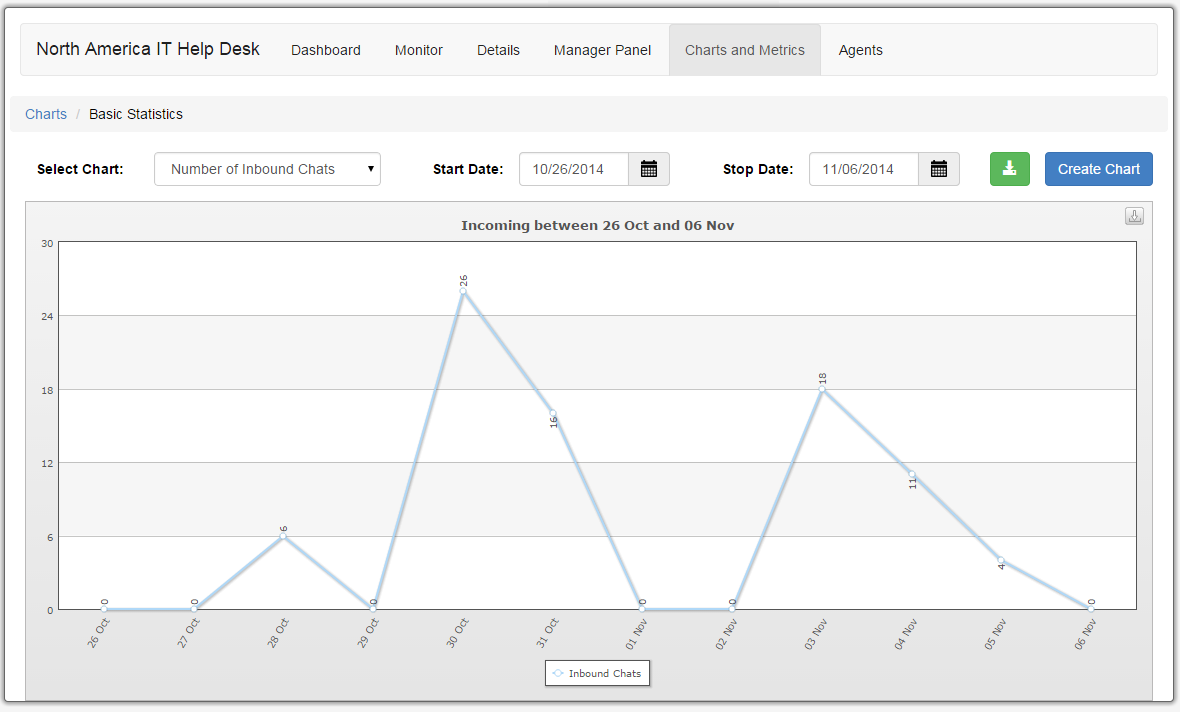
| Number of Inbound Chats | Total number of inbound chats | Line Graph |
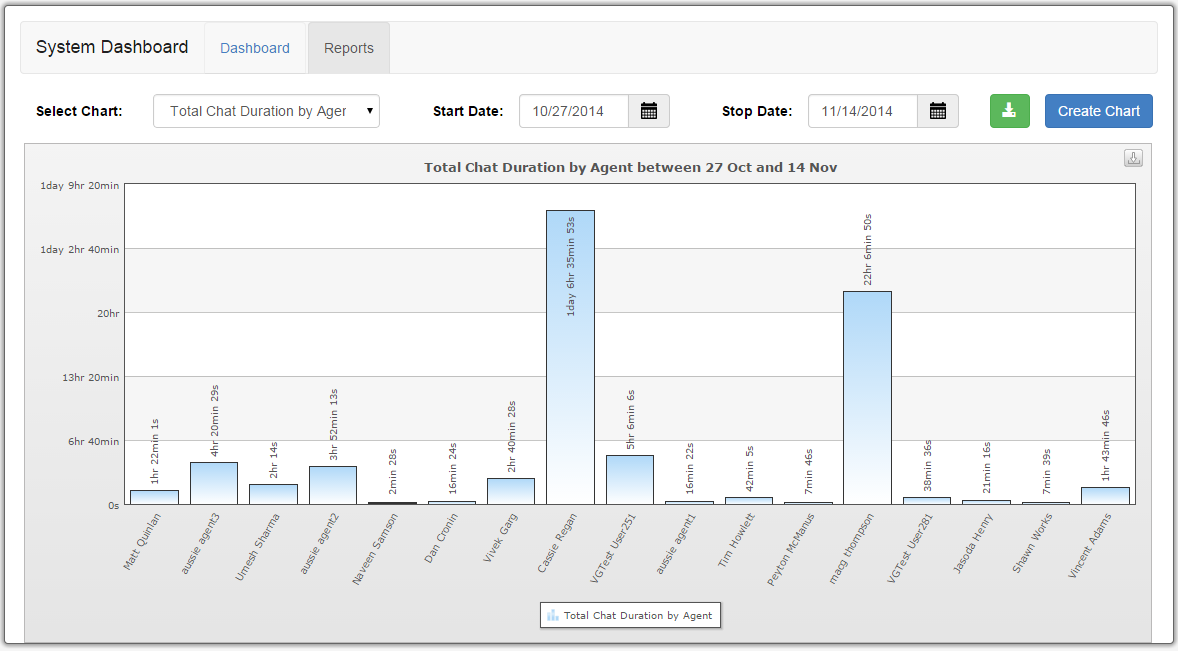
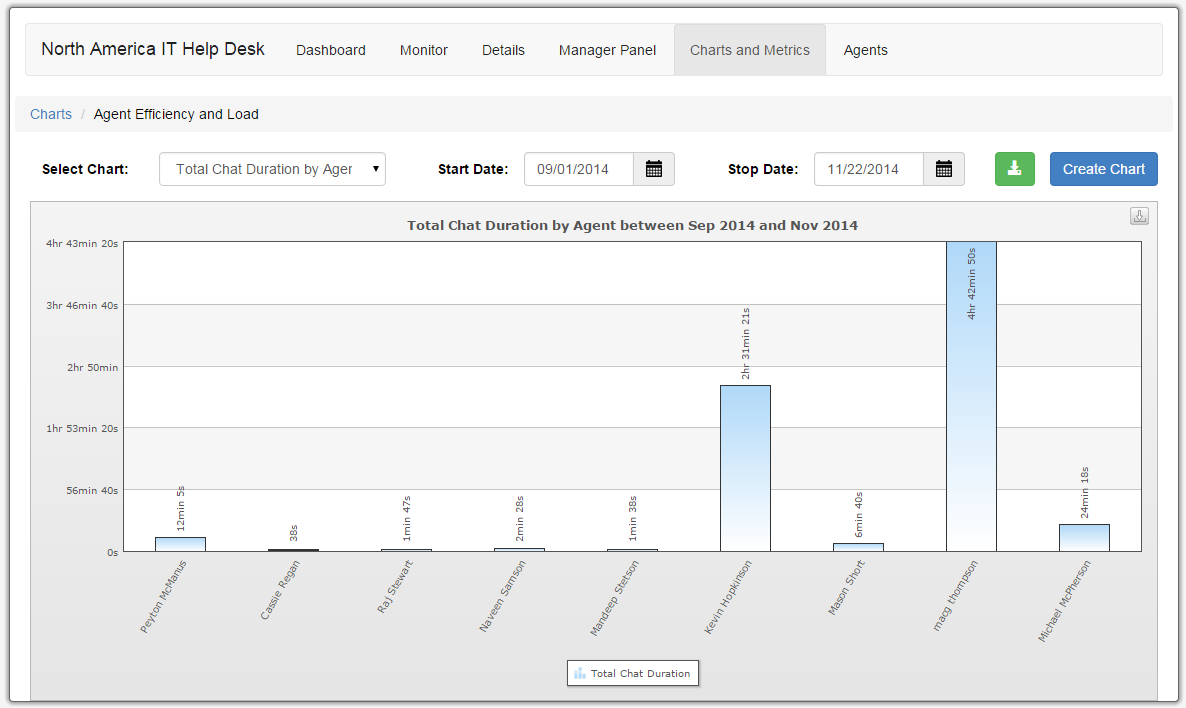
| Total Chat Duration by Agent | Total time spent in chat per agent | Bar Graph |
| Total Chat Duration by Queue | Total time spent in chat of all agents in each queue | Bar Graph |
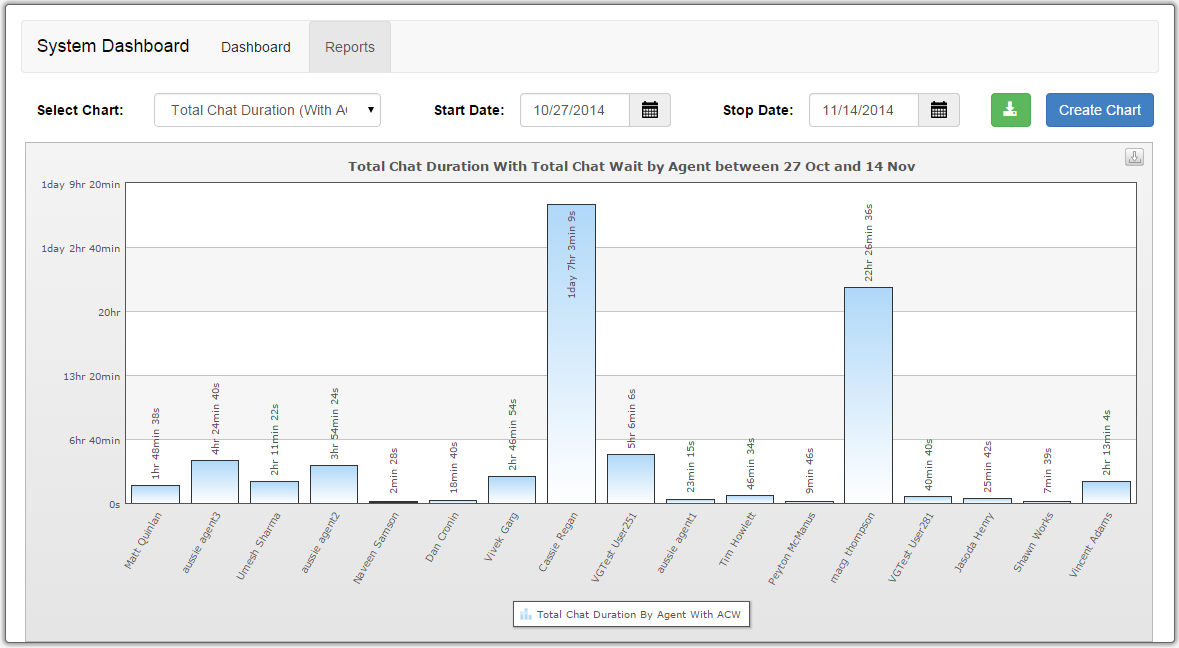
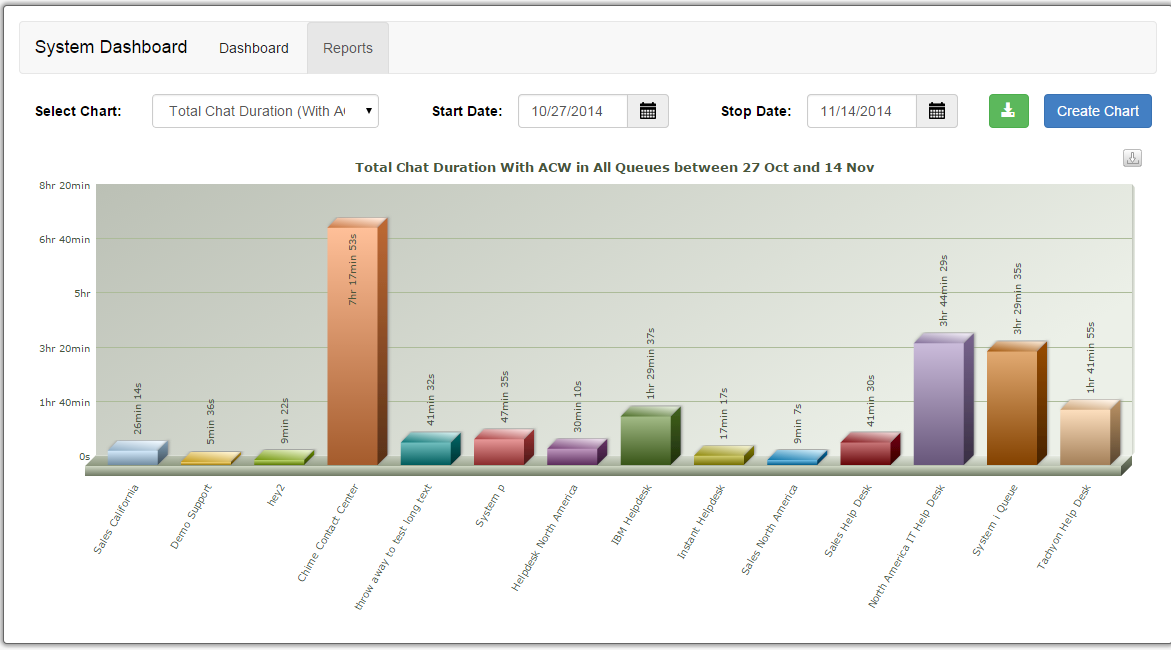
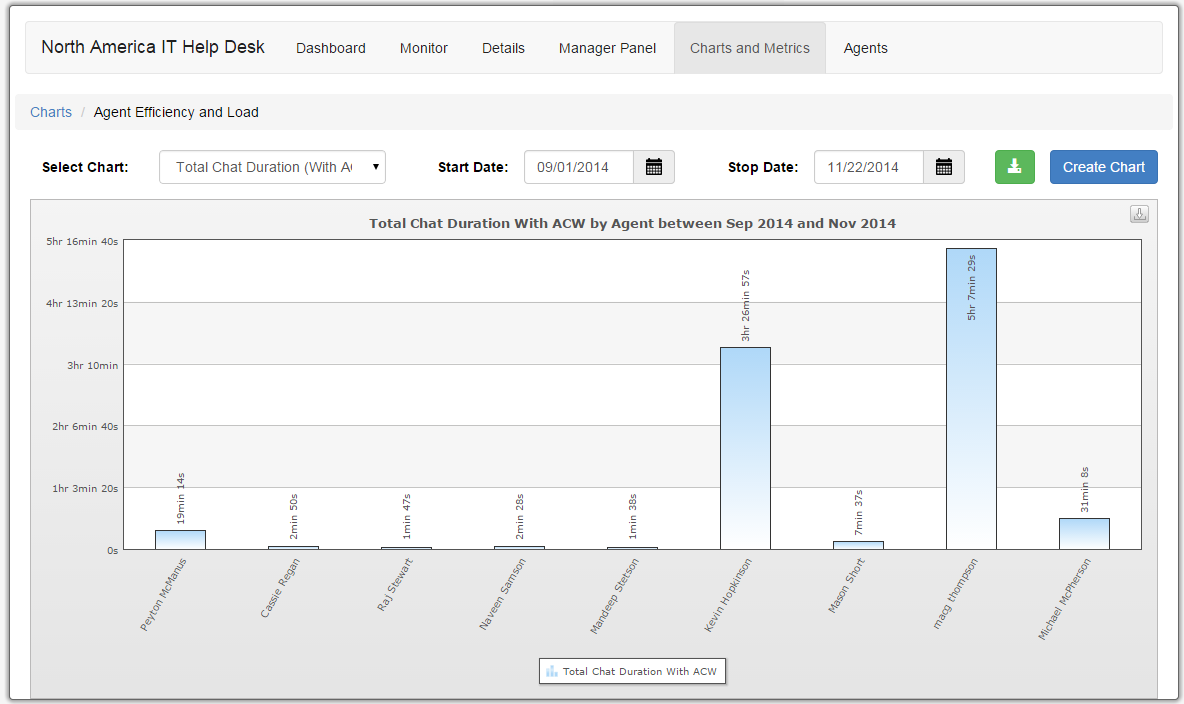
| Total Chat Duration (With ACW) by Agent | Total chat duration with After Chat Work mode for each agent | Bar Graph |
| Total Chat Duration (With ACW) by Queue | Total chat duration with After Chat Work mode for all agents in each queue | Bar Graph |
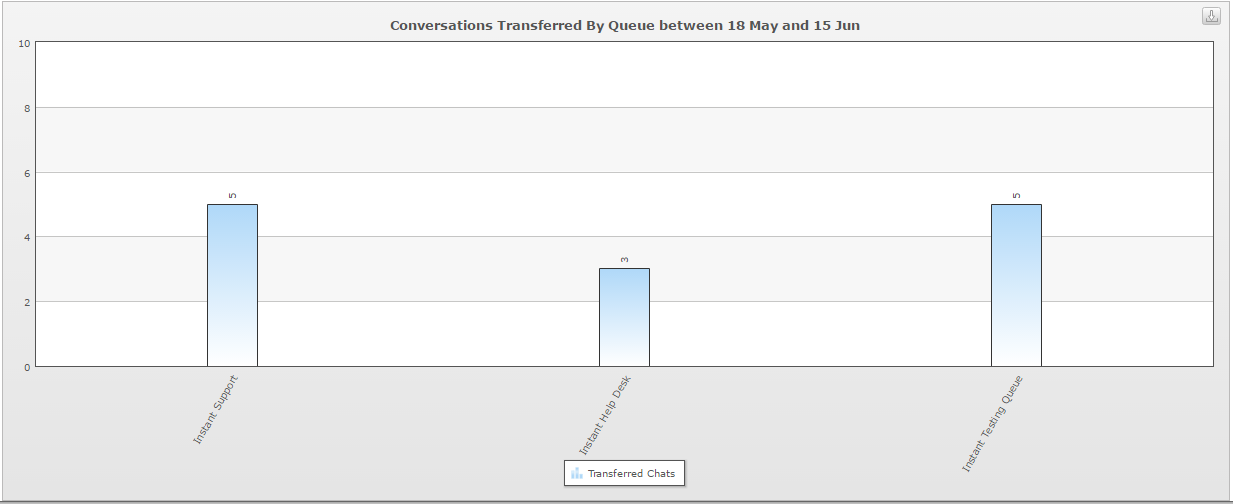
| Transferred Chats by Queue | Total number of chats transferred by queue | Bar Graph |
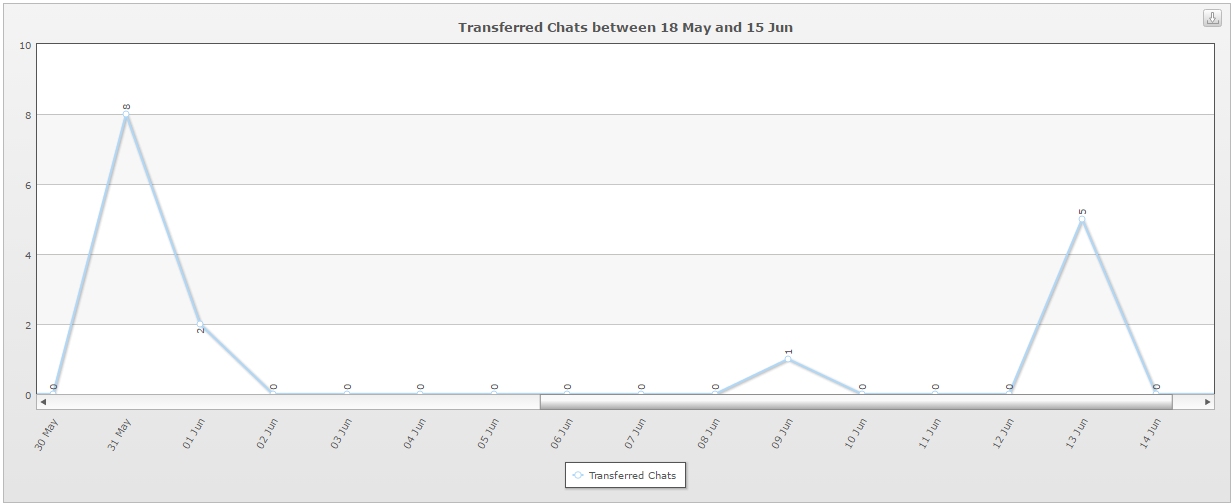
| Transferred Chats Over Time | Total number of chat transferred in a period of time by queue | Line Graph |
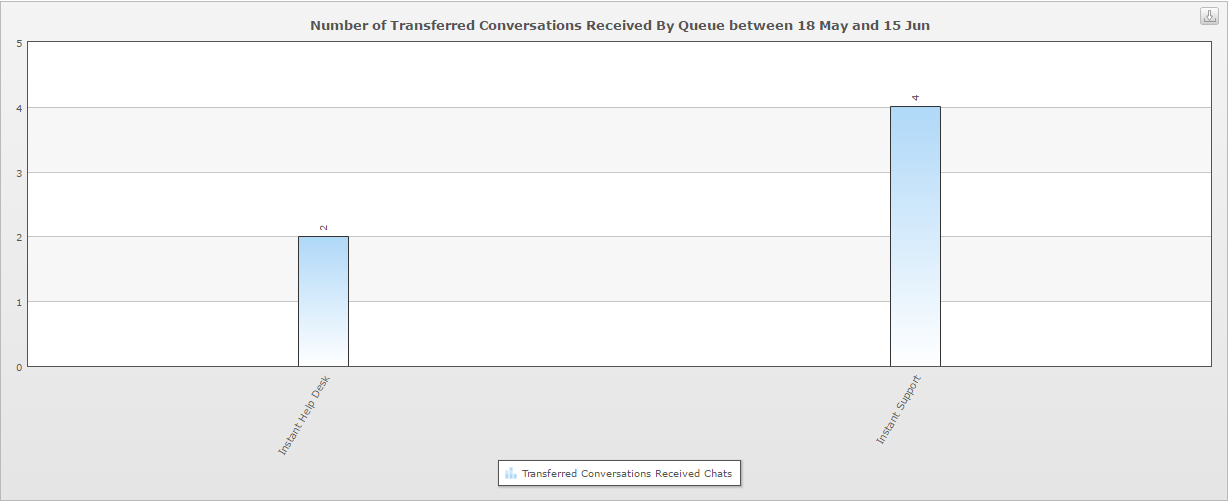
| Transferred Chats Received by Queue | Total number of transferred chats received by queue | Bar Graph |
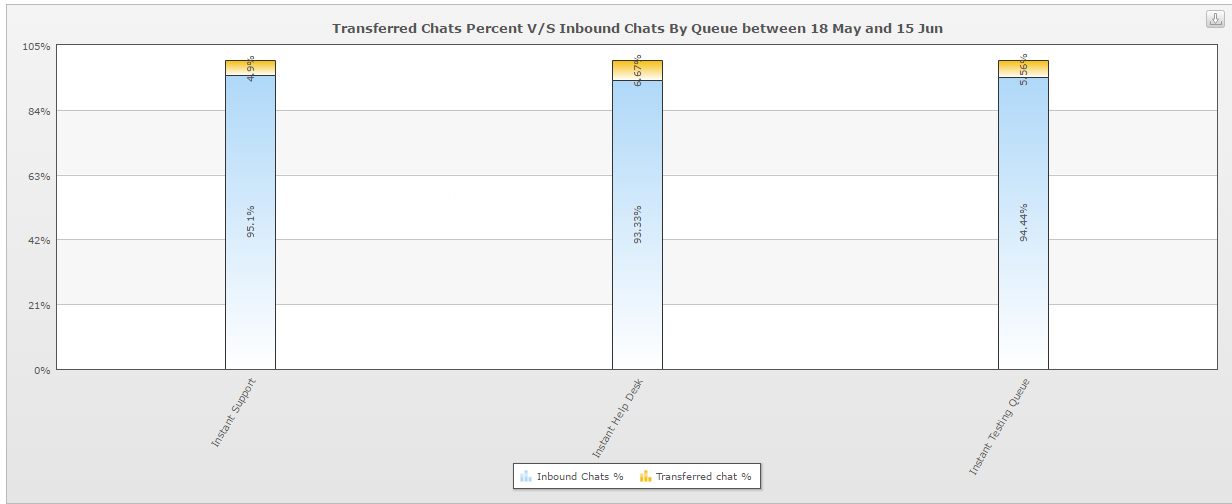
| Transferred Chats vs Incoming Chats Percent by Queue | Shows the percent of transferred chats vs inbound chats per queue | Split Bar Graph |
Queue Level (Click the Chart Name for a screen shot of an example)
| Chart Name | Chart Description | Chart Type |
|---|---|---|
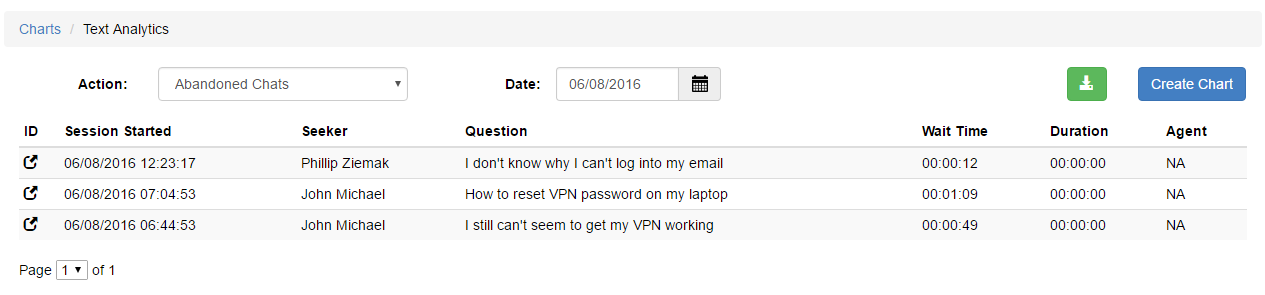
| Abandoned Chats | Shows chat statistics for chats that were abandoned by a seeker in a queue | Table Chart |
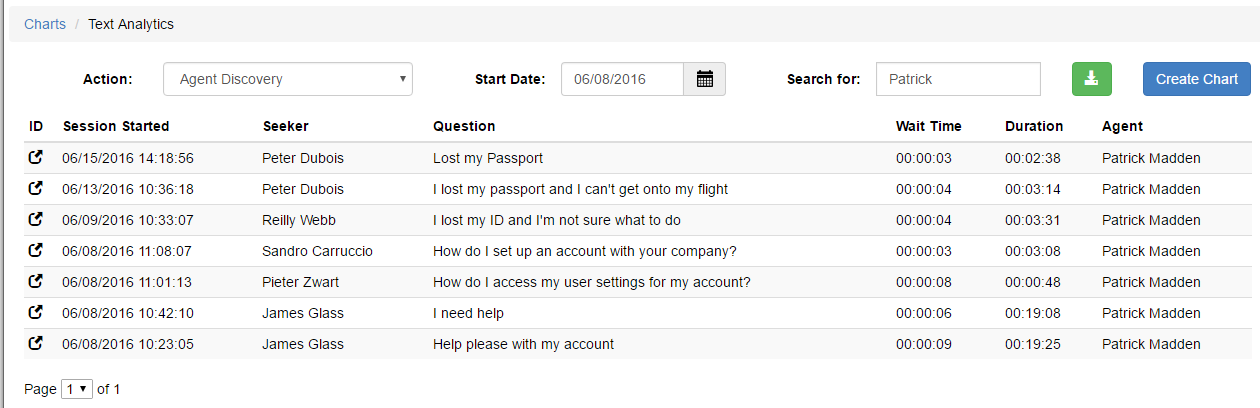
| Agent Discovery | Allows you to search by agent and display their chats in a queue | Table Chart |
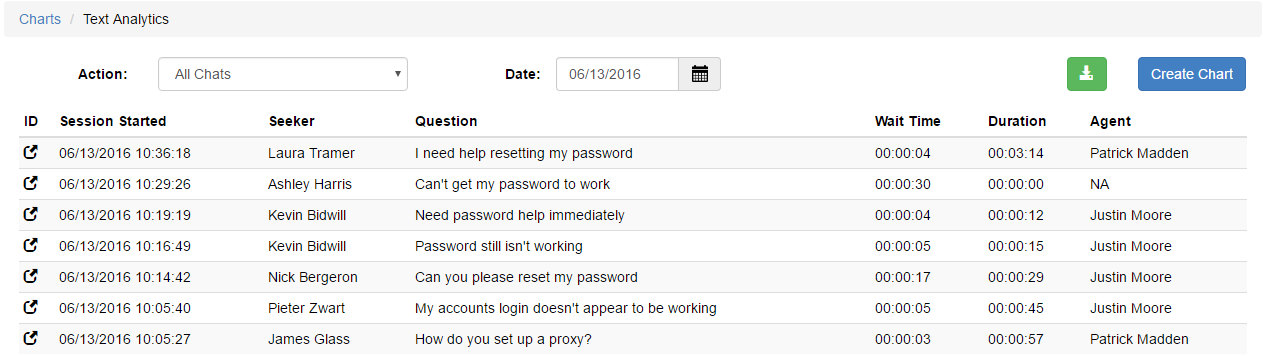
| All Chats | Shows all types of chats that went through a queue in a given day | Table Chart |
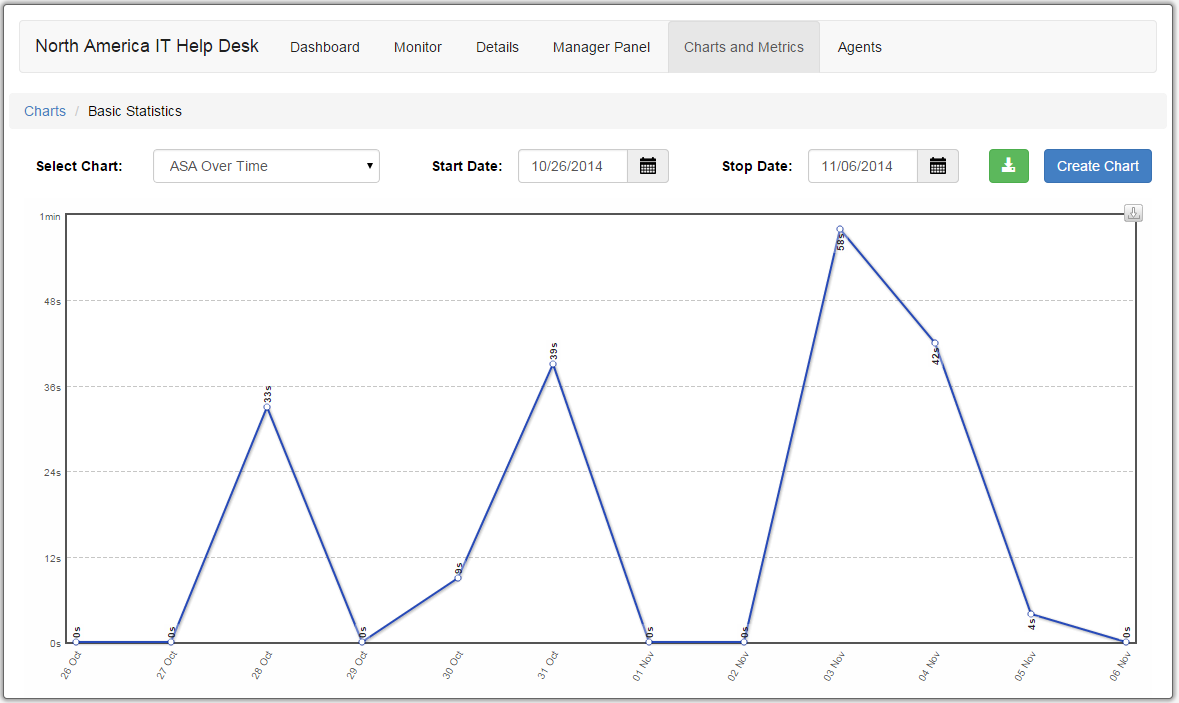
| ASA Over Time | Average Speed to Answer for all agents in specified queue | Line Graph |
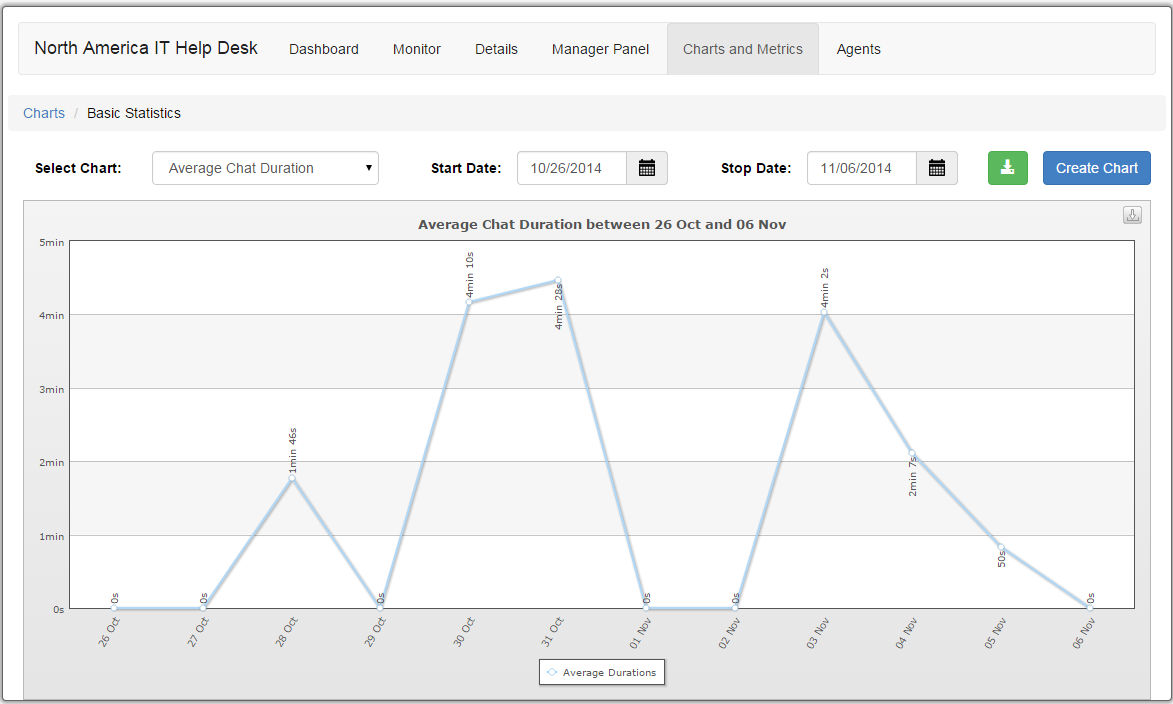
| Average Chat Duration | Average chat duration for all agents in specified queue | Line Graph |
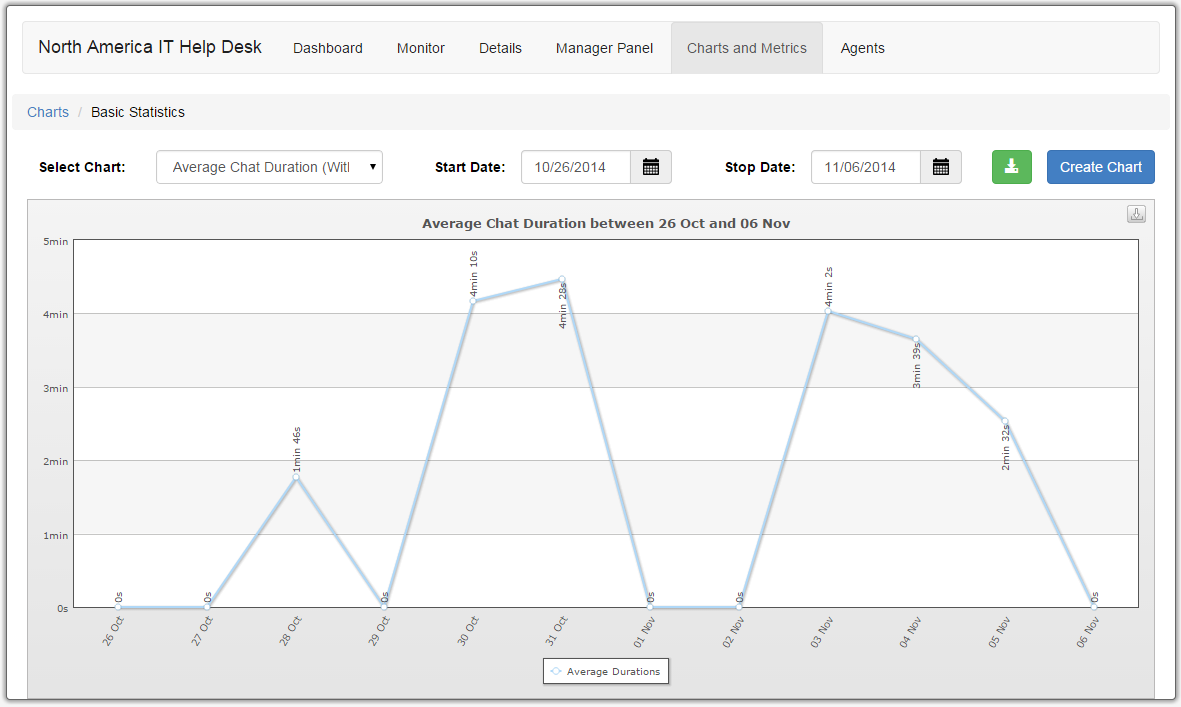
| Average Chat Duration (With ACW) | Average chat duration including After Chat Work for all agents in specified queue | Line Graph |
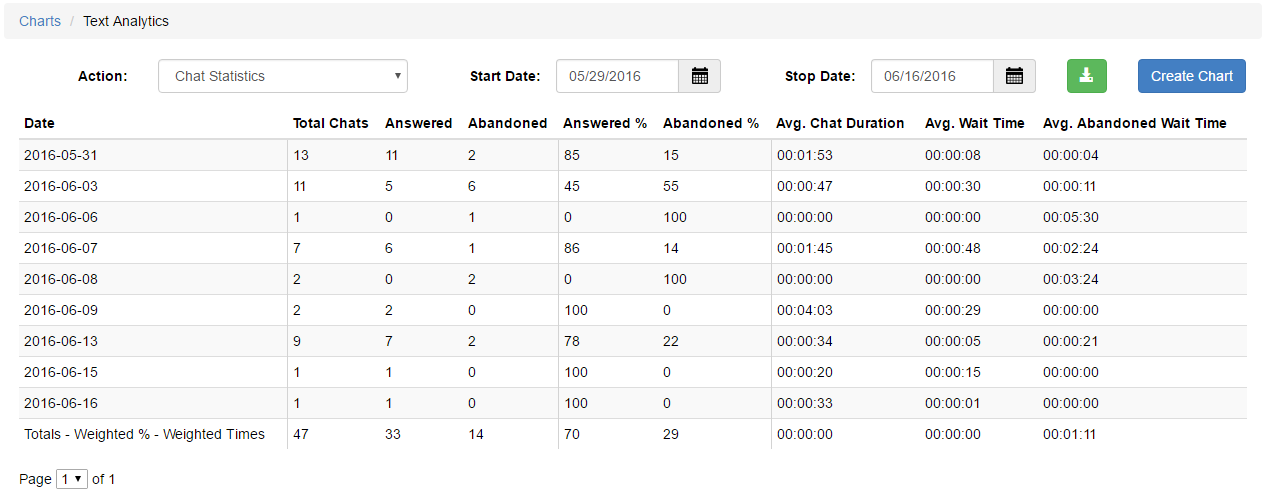
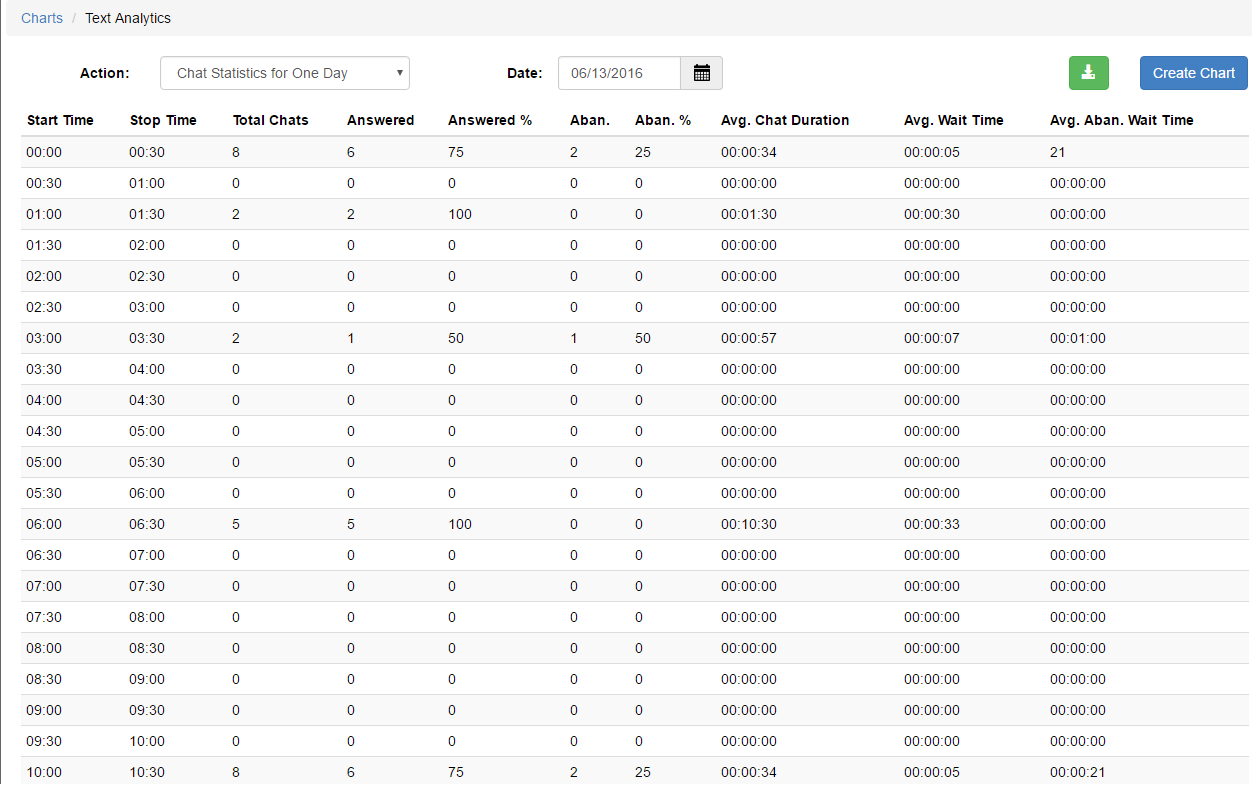
| Chat Statistics | Shows statistics of chats in a queue, such as total chats, answered %, average wait time, etc. | Table Chart |
| Chat Statistics for One Day | Shows one day of statistics of chats in a queue, such as total chats, answered %, average wait time, etc. | Table Chart |
| Dropped Over Time | Total number of dropped chats in specified queue | Line Graph |
| Number of Connected Chats | Total number of connected chats in specified queue | Line Graph |
| Number of Inbound Chats | Total number of inbound chats in specified queue | Line Graph |
| Inbound vs Answered | Total number of inbound vs. answered chats in specified queue | Line Graph |
| ASA by Agent | Average Speed to Answer for each agent in specified queue | Bar Graph |
| Average Chat Duration by Agent | Average chat duration for each agent in specified queue | Bar Graph |
| Average Chat Duration (With ACW) by Agent | Average chat duration including After Chat Work for each agent in specified queue | Bar Graph |
| Conversations by Agent | Total number of conversations for each agent in specified queue | Bar Graph |
| Declined Ignored Count by Agent | Total number of declined and ignored for each agent in specified queue | Bar Graph |
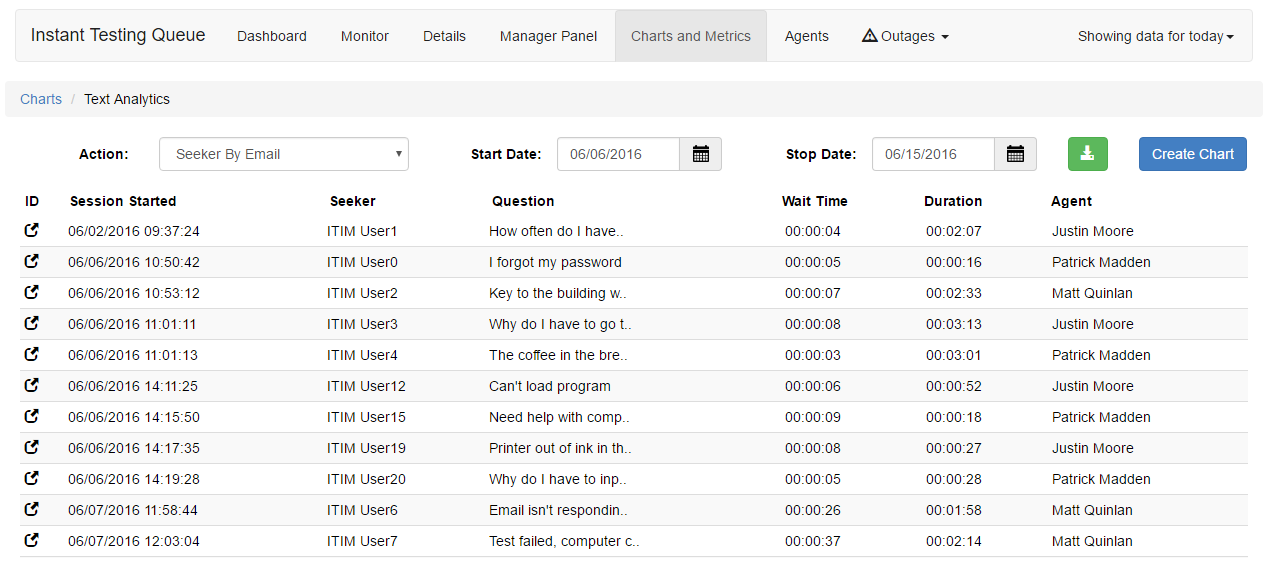
| Seeker by Email | Shows all seekers by email who have entered a queue | Table Chart |
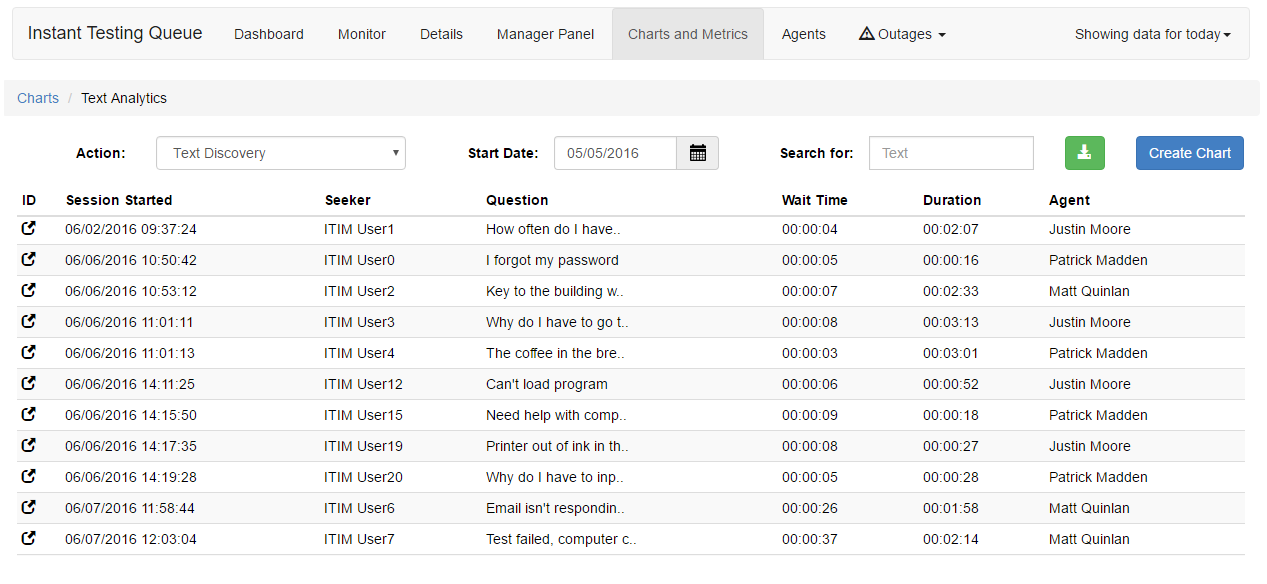
| Text Discovery | Allows you to search by words used in a chat in a queue | Table Chart |
| Total Chat Duration by Agent | Total chat duration for each agent in specified queue | Bar Graph |
| Total Chat Duration (With ACW) by Agent | Total chat duration including After Chat Work for each agent in specified queue | Bar Graph |
| Total Chats Transferred by Agent | Total number of chats transferred by an agent in a queue | Bar Graph |